Download
1 / 29
290 likes | 396 Views
Hypothesis Testing. Fertility of American Women (aged 15-44), 1980-2006. Births per 1,000 women. Births per 1,000 women. UT. UT. NH. NH. SOURCE: www.census.gov/population/www/socdemo/fertility.html#hist. yr = 0, …, 26. ^. Hypothesis Testing of .

E N D
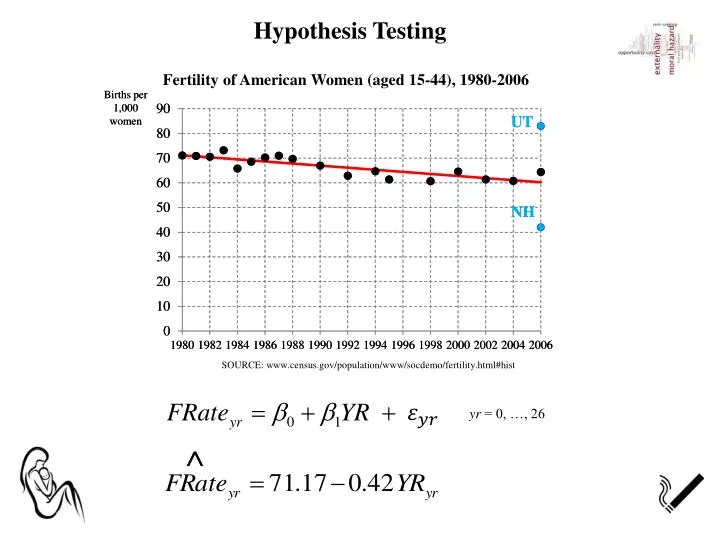
Hypothesis Testing Fertility of American Women (aged 15-44), 1980-2006 Births per 1,000 women Births per 1,000 women UT UT NH NH SOURCE: www.census.gov/population/www/socdemo/fertility.html#hist yr = 0, …, 26 ^
Hypothesis Testing of Suppose you are asked to empirically investigate the charge that obstetricians are guilty of inducing demand by performing unnecessary cesarean sections. Empirical Model (linear-log) s = 1, …, 47 t = 1, …, 13 (1970 to 82) Panel data
Empirical Model (linear-log) s = 1, …, 47 t = 1, …, 13 (1970 to 82) Gruber and Owings (1996) OLS regression ^ where _____ CRate = 0.119 11.9% of deliveries are by cesarean section Standard error of The hypothesis test of answers the question of whether is negative enough to be convincing evidence that the true coefficient is negative rather than simply being negative due to chance. But first, let’s interpret what the estimated coefficient means, assuming temporarily that it is statistically significant.
What is the predicted effect of a 10% decrease in the fertility rate? ^ ^ point Gruber and Owings interpretation of “A fall in the fertility rate of 10 percent is associated with an increase in the likelihood of cesarean delivery of 0.97 percentage points.” (p. 113)
Set H0 and H1 Does the empirical evidence convincingly knock H0 down? Testing for demand inducement by obstetricians (OBs): Gruber and Owings use economics to tell a story of why this might be true. Two types of potential errors
Hypothesis Testing of ___ ___
Normally, a negative sign for is not sufficient to convince us to reject the null hypothesis and, in this case, conclude that OBs are guilty of inducing demand by carrying out unnecessary c-sections. Instead, has to be sufficient smaller than zero for us to be relatively confident that the true is negative. In other words, has to be smaller than some critical negative value, call it , for us to be willing to reject the null hypothesis. Decision Rule Choose by setting Type I error Reject true H0 Suppose Prob (Type I error) = significance level of the test
Given how would you illustrate the probability of making a Type II error? Type II error: accept a false H0. Suppose Note: There is no way to measure Type II error without knowing the true value of
As the significance level of the test becomes more stringent, what happens to the prob(Type I error) and prob(Type II error)? Given that changing the critical value decreases the probability of making one type of error while increasing the probability of making the other type of error, how should we set ? Setting . Think about the cost of making each type of error. • unnecessary c-sections
Typical practice set the significance level so that the probability of making at type I error is small. Prob(Type I error ) is typically set at either .10, .05 or .01 But you should always question whether the typical practice is appropriate. How do you find One possibility: solve for where Too cumbersome, requiring that we solve difficult problems for every new hypothesis.
How do you find Easier process: transform the test statistic into a standard normal one. Define z statistic as: But if H0 is true, then , so Standard normal distribution Much easier a table of the standard normal distribution can be used to find the critical value for a variety of hypothesis tests.
BUT how do we calculate when is unknown? Standard deviation of Solution substitute , which is the standard error of , for t statistic t distribution k+1= # parameters n = Sample size The shape of the t distribution depends on the number of degrees of freedom. It is a little fatter than the standard normal distribution due to the increased variation of estimating
College-Age Smokers Is their demand for cigarettes inelastic? Is the demand of female smokers different from males? Questions: Empirical Specification: OLS Fitted Line : Question 1. Set H0 and H1: Set & find : Let . Since 300, >
OLS Fitted Line : Question 1. Set H0 and H1: Set & find : Let . Since 300, >
What economists call… Example: The growth of multiplayer gaming, in which players converge online to compete against one another, makes big games bigger through the benefit of what economists call the network effect, analysts and game executives say. This is the tendency for people to jump on the bandwagon of various services -- whether Facebook or Craigslist -- because that is where everyone else is. —“The Only Game in Town,”The New York Times, September 30, 2013
What sociologists call… Example: So much for ''till death do us part.'' For the first time, more Americans 50 and older are divorced than widowed, and the numbers are growing as baby boomers live longer. Sociologists call them gray divorcees. —“Divorce After 50 Grows More Common,” The New York Times, September 13, 2013
Figure 1. Journalists use of Social Science Terminology, 1994-2013 Newspaper Articles (# per year) economists Anthropologists Political Scientists Psychologists Sociologists
Empirical Specification where and is the number of U.S. newspaper articles in year t that use the phase “what call,” where is either anthropologists, economists, political scientists, psychologists, or sociologists. (Note: when syndicated columnists, such as George Will, use this phrase in one of their columns, it is only counted once.) called a dummy, indicator or qualitative explanatory variable But is the difference statistically significant?
Second Empirical Specification where and is an interaction term between and .
Figure 1. Journalists use of Social Science Terminology, 1994-2013 Newspaper Articles (# per year) economists Anthropologists Political Scientists Psychologists Sociologists
Figure 1. Journalists use of Social Science Terminology, 1994-2013 Newspaper Articles (# per year) economists Increase in the slope equals the coefficient on the interaction term Anthropologists Political Scientists Psychologists Sociologists Coefficient on the dummy variable
Table 1. Economic versus Other Social Science Terminology in Newspapers, 1994-2013. Designing Tables of Regression Results: • Self-explanatory • Interesting Title • Define variables—no acronyms • Explanatory variables of central interest up top • t-stat versus standard errors: • t-stat—most readers want it but implies • Standard errors: more flexible; makes your reader think a bit • Asterisks—some journals ban them • Rounding three significant digits; 2nd or 3rd decimal place.