Download
1 / 48
480 likes | 578 Views
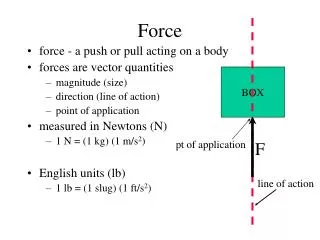
May the Force Be With You: Understanding Market Forces and How They are Relevant to Planning. Becky Knudson: Household Travel Demand Denise Whitney: Land Use Development Christina Fera-Thomas: Traffic Flow Oregon Planning Institute Statewide Planning Conference 2008

E N D
May the Force Be With You:Understanding Market Forces and How They are Relevant to Planning Becky Knudson: Household Travel Demand Denise Whitney: Land Use Development Christina Fera-Thomas: Traffic Flow Oregon Planning Institute Statewide Planning Conference 2008 Friday, September 12, 2008
May the Force Be With You:Understanding Market Forces and How They are Relevant to Planning Becky Knudson: Household Travel Demand Oregon Planning Institute Statewide Planning Conference 2008 Friday, September 12, 2008
Overview • Households as economic engines • Participate in “activities” • Budgets constrain activity levels • Multiple needs to satisfy within a budget • Activity generates travel • Travel is a derived demand • Land use attracts travel • Business location affects travel patterns
Households are Economic Engines • Households participate in activities • Provide labor for production • Spend income to purchase goods and services • Activities generate travel • Trips to work • Trips to shop • Trips for recreation • Trips for HH production
Household Consumption is 70% of Economy Labor Income Travel Demand Derived from Household Activity Produce Consumption Goods Buy Goods & Services Recreation
Household Activity Constrained by Budget • Households adapt spending patterns • Shift spending from one category to another to meet their goals • Consumer Expenditure Survey provides a look into household budgets and spending patterns
Consumer Expenditure Survey • Bureau of Labor Statistics sponsored • Conducted by Census Bureau annually • Diary survey – two weeks, and • Interview survey – previous three months • Used to construct the Consumer Price Index
Budget Categories & Results • Housing • Household operations • Transportation • Food • Utilities • Health care • Apparel • Entertainment • Misc.
Consumer Expenditure Survey 2006 Household Spending by Budget Category
Consumer Expenditure Survey 2006 Household Spending by Budget Category Housing costs include: rent, mortgage principle and interest, property tax, maintenance, and insurance. Year 2000 housing was 31% of disposable income
Consumer Expenditure Survey 2006 Household Spending by Budget Category Utility costs include: electricity, natural gas, heating oil, telephone, water Year 2000 utilities were 6% of disposable income
Consumer Expenditure Survey 2006 Household Spending by Budget Category Food costs include: food out of home and food at home Year 2000 was 13% of budget Year 2000 at home food was 59% of food budget, Year 2006 is was 56% of food budget
Consumer Expenditure Survey 2006 Household Spending by Budget Category Transportation costs include: vehicle purchase, fuel & oil, maintenance and repair, financing, insurance, licensing Year 2000 vehicle purchase was 46%, Year 2006 it was 40% Year 2000 gas & oil were 17%, Year 2006 they were 26%
Household Activity Can be Simulated • Household surveys provide information used to create models representing regional travel patterns • Oregon Household Activity Survey 2008 • Travel demand models and traffic simulations are tools designed to represent household travel behavior • THE MODELS WORK! Analysis conducted by TPAU over ten years ago accurately predicted travel patterns we observe today
Land Use Affects Household Travel Households travel … to businesses to work, shop, eat… Land use patterns affect travel • Housing density • Business locations
Example Case Study – Placer Vineyards (Sacramento, CA Area) • 5200 acre site on edge of UGB • Three alternative proposals • “Blueprint” higher density alternative with 21,000 households • Two lower density alternatives with 14,000 households • Designed to evaluate “Where will the growth go and what are the effects?” Example from “Integrated Planning and Connected Models” Gordon Garry, SACOG, 5th Oregon Symposium on Integrating Land Use and Transport Model, June 2008
Example Case Study – Placer Vineyards (Sacramento, CA Area) 5200 acre site on edge of UGB Three alternative proposals “Blueprint” higher density alternative with 21,000 households Two lower density alternatives with 14,000 households Designed to evaluate “Where will the growth go and what are the effects?” Example from “Integrated Planning and Connected Models” Gordon Garry, SACOG, 5th Oregon Symposium on Integrating Land Use and Transport Model, June 2008 • PLACE3S, an acronym for PLAnning for Community Energy, Economic and Environmental Sustainability, is an innovative planning method that fully integrates focused public participation, community development and design, and computer-assisted quantification tools (GIS) to help communities produce plans that retain dollars in the local economy, save energy, attract jobs and development, reduce pollution and traffic congestion and conserve open space. • http://www.energy.ca.gov/places/
Example Case Study – Placer Vineyards (Sacramento, CA Area) 5200 acre site on edge of UGB Three alternative proposals “Blueprint” higher density alternative with 21,000 households Two lower density alternatives with 14,000 households Designed to evaluate “Where will the growth go and what are the effects?” Example from “Integrated Planning and Connected Models” Gordon Garry, SACOG, 5th Oregon Symposium on Integrating Land Use and Transport Model, June 2008
Higher density: 21K households Daily VMT: 920K (18% - 22% lower) Person trips bike/walk/transit: 8% Person trips private auto: 91% DVMT per HH: 43 2 Lower density scenarios: 14K households 7K households placed in most likely area Daily VMT: 1120K - 1180K (22% - 28% higher) Person trips bike/walk/transit: 4.8% - 5.3% Person trips private auto: 93.5% - 93.9% DVMT per HH: 55
Results from Sacramento Study • Higher density land use resulted in • Less VMT • Fewer emissions • More bike/walk/transit • Provided more green space
Conclusions • Each household represents a unique set of activities and strategies designed to satisfy needs and desires • Effective transportation planning supports household activity while conserving public resources BUT • Households represent one piece of the travel puzzle – trip generators
Land Use Development • Business attracts activity • Workers • Customers • Shipping goods/services • Receiving goods/services • Land use patterns are determined by another set of market forces
May the Force Be With You:Understanding Market Forces and How They are Relevant to Planning Denise Whitney: Land Use Development Oregon Planning Institute Statewide Planning Conference 2008 Friday, September 12, 2008
Household & Employment Activities Need to Be Located Labor Income Produce Consumption Goods Buy Goods & Services Recreation
Where Land Use and Real Estate Development Begin:Opportunity to Meet Market Need Property Owner Land Speculator Predeveloper (private or public) Land/Real Estate Developer
Clients: users investors buyers Public Development Team Market Forces Viable Location(s) Project Idea: opportunity to meet need Local & State Govt. Developers Juggle Many Considerations
Market Forces (national, regional) • Employment and industry trends • Population and demographic trends • Real estate market trends • Development trends • Capital markets • Commodities markets
Viable Location (factors in site selection) • Physical features • Transportation • Price of the land • Zoning • Utilities • Government services/costs • Local attitudes • Local market forces
Accessible and desirable location Adequate site size and configuration to meet building design and parking needs Access to technological infrastructure Transportation linkages (shipping time is money) Adequate site size and configuration with room to grow Utilities with sufficient capacity to handle requirements Avoiding conflicting land uses Proximity to resources and housing Industrial Office Considerations by Development Type
Sufficient population/households with right income and demographic mix within market area Visibility and traffic (pedestrian or auto) Accessible site of sufficient size Amenities such as neighborhood parks and schools Availability of transit Proximity to freeway access and/or employment nodes Proximity to shopping districts Retail Residential Considerations by Development Type
Condominium Pro Forma Retail Trade Area – Market Study Bottom Line: Does it pencil? Project Feasibility and the Bottom Line
People Location Financing & Feasibility Market Need A Project Occurs Only if Pieces Come Together within Developers Planning Time Frame
Understanding Market Forces & Development Basics Makes for More Effective Planning Incentives – Work best when project is close to being feasible and incentive can nudge it into profitable range. Zoning – Can be more effective when recognizing desirability of locationsand site needs by development type. Fee Structures – That recognize developers need for certainty upfront are more likely to capture funds without inhibiting growth. Community Expectations – Can be more realistic when market influences on development/redevelopment are acknowledged. Understanding the influence of market forces on land use and travel patterns leads to better transportation facility planning. Transportation Facilities –
May the Force Be With You:Understanding Market Forces and How They are Relevant to Planning Market Forces Affect Traffic Flow Christina Fera-Thomas Transportation Analyst Transportation Planning Analysis Unit September 12th 2008
ODOT Responsibility to Maintain State-Owned Facilities • Improve safety • Maintain an efficient roadway system • Meet FHWA standards and guidelines for highways on the interstate system • Provide Connectivity • Throughout the state • To local areas
ODOT Responsibility to Maintain State-Owned Facilities-cont’ • Move goods and people efficiently • Consider all modes: auto, bicycle, pedestrian, rail, ect • Improve livability to communities • Support for economic prosperity and opportunities
40 390 400 855 85 90 405 70 795 45 20 35 Overview of the Analysis Process • Determine Study Area • Collect data • Develop Volumes • Analyze Alternatives
Determine Study Area • Generally larger than the project area because: • Nearby facilities may be affected • Roadways outside of immediate project area may end up being part of a build alternative
Project Area Study Area Interchange Count Locations Determine Study Area
Collect Data • Obtain Signal Timing Sheets • Collect field inventory • Lane/crosswalk/shoulder widths • Turn bay lengths • Detector positions • Signal Operation • Miscellaneous observations • Request Counts • Full Classification • 16 hour
40 390 400 855 85 90 405 70 795 45 20 35 Develop Volumes Design Hour Volumes • Seasonally adjust (if necessary) • Apply Growth Factor (if necessary) • Historical • Model • Balance System
Develop Volumes Future Volumes/Build Volumes • Apply Growth Factor • Historical • Model • Cumulative • Balance • Create build model scenario if: • Model is available • Traffic patterns will be affected
Analyze Alternatives • Use of Synchro/Simtraffic or comparable software • Compare performance of no-build and build alternatives to mobility standards • Determine lengths of queues and their affect on the system • Report additional performance measures
Case Study - Home Depot • Home Depot Built within the project area • First Home Depot in Model Area as well as the county • Only one other Home Improvement Superstore within the model area • Will pull trips from the entire model area and beyond • Model Scenarios will need to include Home Depot which will show: • Any increase of trips within the study area • How trips have been redistributed amongst the major roadways into the study area
Case Study - Home Depot • Model Outputs would be used to create new volumes that include the development • Analysis of the new volumes would show the affect Home Depot has on the system • Depending on the affects; the developer may be required to assist with the project costs
8 Miles Case Study - Home Depot
Questions? Answers: Becky Knudson Rebecca.a.knudson@odot.state.or.us Denise Whitney Denise.d.whitney@odot.state.or.us Christina Fera-Thomas Christina.a.fera-thomas@odot.state.or.us