Download
1 / 35
380 likes | 696 Views
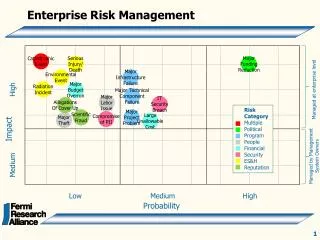
Enterprise Risk Management. Overview of ERM Introduced in lecture 9 What’s Driving ERM? Conference Board Report on ERM Basic Approach Examples of ERM Adopters ERM Metrics Conclusion. Overview of ERM. ERM is a journey, not a one time event

E N D
Enterprise Risk Management • Overview of ERM • Introduced in lecture 9 • What’s Driving ERM? • Conference Board Report on ERM • Basic Approach • Examples of ERM Adopters • ERM Metrics • Conclusion
Overview of ERM • ERM is a journey, not a one time event • ERM is not just compliance, it needs to be embedded in the culture to be successful • ERM starts at the top • ERM takes the commitment of the management team • ERM takes time to develop
Enron • WorldCom • Adelphia • Mutual Funds Corporate Disasters • Banks • Asset Managers • Energy Firms • Corporations Best Practices RegulatoryActions • S.E.C. • Sarbanes-Oxley • Basel II • Treadway Report, US • Turnbull Report, UK • Dey Report, Canada IndustryInitiatives The growing acceptance of ERM is driven by four key forces EnterpriseRiskManagement
Conference Board Study • Analysis of Fortune 100 Companies- 11/05-2/06 • Survey (4% response rate) and interview process • Sample by Revenue • 13.5% < $1B • 41.2% $1B- $5B • 26.2% $5B- $15B • 19% > $15B • Sample by Industry • 19% energy/ utility • 24.1% manufacturing • 26.7% financial services • 30.1% non financial services
Conference Board Key Findings • Evolving legal developments make it prudent for directors to ensure there is a robust ERM process in place • Expanding scope of fiduciary duties • SEC endorsement of self regulatory frameworks • NYSE listing standards • Federal sentencing guidelines • More directors acknowledge they must oversee business risks as a part of their strategy setting role • Consider making improvements in ERM oversight • Sound ERM oversight and implementation practices are recognized in leading companies • Opportunity to learn from best-in-class ERM industries (financial, energy/ utility)
Conference Board Recommendations • Review committee structure and charters • Clear who is responsible for risk management • Audit Committee for most companies, but they may be over-burdened • Dedicated risk committee for some companies • Review board member competencies for managing risk • Strengthen the Board as needed • Training the Board on risk management • Develop risk management process to ensure members are fulfilling their fiduciary duties • Consider robust board level ERM reporting system • Provide information, not data (prioritized risk list, action plan, etc) • Develop a process to assess and monitor risk management process • Review done at Board level at least once per year • Spend time with management to understand risk issues • Interact with executives with best perspective on key risks
Rating Agency and Insurance Company Considerations • Moody’s and Standard and Poors’ now incorporate risk management assessment into credit ratings • S&P Commentary • banking and insurance sectors 2 years ago • Report on insurance industry coming out soon • Looking at trading risk for the energy sector • Considering other industries • “Companies who manage risk effectively should receive “credit” in the rating process” • Insurance companies • (D&O underwriters) consider rating agency opinions • Underwriters look favorably toward companies who are focused on managing risk
One Framework for ERM • Committee of Sponsoring Organizations of the Treadway Commission ( COSO ) • Published Enterprise Risk Management-Integrated Framework in 2004 • COSO has defined ERM as … A process, effected by an entity’s board of directors, management and other personnel,applied in strategy setting and across the enterprise, designed to identify potential events that may affect the entity, and manage risk to be within its appetite, to provide reasonable assurance regarding the achievement of entity objectives.
Traditional risk management • Six step process • Risk identification • Risk analysis • Development of alternative techniques to treat risks • Selection of best risk-treatment techniques • Implementation of selected techniques • Evaluation and monitor of effectiveness of risk management
Ten key questions to consider • What is our appetite for risk? (capacity and propensity) • Do we know what our risks are? • Do we know how those risks relate to one another? • Who within our company “owns” those risks? • Can we measure those risks? • Have we evaluated non-traditional risks? • Does everyone at our company understand their role in managing risk? • Is effective risk management linked to performance evaluations? • Is risk considered in all facets of decision making? • Does our company continually look for ways to optimize risk strategy?
ERM Expands Traditional Risk Management • More fully integrates risk management into the organization’s structure • ERM is an interactive process not a reactive process
The role of a chief risk officer (CRO) • Establish an ERM framework – policies, processes, and systems • Manage risk interdependencies and aggregations • Provide risk transparency to key stakeholders • Ensure company practices meet or exceed regulatory requirements • Balance business and risk requirements, and avoid “irrational exuberance” • Optimize risk/return by integrating ERM into strategic planning and day-to-day business processes • Attract, retain, and develop talented risk professionals
1. Corporate Governance Establish top-down risk management 3. Portfolio Management 4. Risk Transfer 2. Line Management Transfer out concentrated or inefficient risks Business strategy alignment Think and act like a “fund manager” 6. Data and Technology Resources 5. Risk Analytics Develop advanced analytical tools Integrate data and system capabilities 7. Stakeholders Management Improve risk transparency for key stakeholders An ERM framework should encompass seven key building blocks
An ERM dashboard should address five key questions for senior management • Are any of our strategic, business, and financial objectives at risk? • Are we in compliance with policies, limits, laws, and regulations? • What risk incidents have been escalated by our risk functions and business units? • What key risk indicators and trends that require immediate attention? • What are the risk assessments that we should review?
Background 3-Year ERM Program • $1 trillion of assets under management • Private company • Decentralized business culture • Organized Global Risk Forum • Implemented annual Global Risk Review • Automated loss accounting • Developed ERM framework • Implemented intranet-based Global Risk MIS • Experienced significant reduction in loss ratio Case study:
Basic risk management processes can lead to significant improvements Education • New associates • Management • Business/Operational processes • Best practices • Lessons learned Actual Loss Experience Risk Event Log 85% Decline Root Controls Event Loss Needed Causes Risk Metrics Goal MAP
Probability Change in Value Economic capital represents a common currency for risk Credit Risk Market Risk Operational Risk • Credit Risk • Earnings volatility due to variation in credit losses • Market Risk • Earnings volatility due to market price movements • Operational Risk • Earnings volatility due to changes in operating economics (e.g. volume, margins or costs) or one-off events Enterprise-wide Risk
Background 2-Year ERM Program • New capital markets business • Traders hired from foreign bank • Aggressive business and growth targets • Established risk policies and systems • Instilled risk culture • Survived “Kidder” disaster • Captured 25% market share with zero policy violations • Recognized as best practice Case study:
Hallmarks of success in ERM at GE • Engaged senior management and board of directors • Established policies, systems, and processes, supported by a strong risk culture • Clearly defined risk appetite with respect to risk limits and business boundaries • Robust risk analytics for intra- and inter-risk measurement, summarized in an “ERM dashboard” • Risk-return management via integration of ERM into strategic planning, business processes, performance measurement, and incentive compensation
ERM Metrics • You cannot manage what you cannot measure • Goal is to measure risk on a common basis
Financial Performance Measures • Return on Equity (ROE) • Operating Earnings • Earnings before interest, dividends, taxes, depreciation and amortization (EBITDA) • Cash Flow Return on Investments (CFROI) • Weighted Average Cost of Capital (WACC) • Economic Value Added (EVA)
Financial Risk Metrics • Return on Capital (Financial Services Industry) • Risk-adjusted return on capital (RAROC) • Return on risk-adjusted capital (RORAC) • Risk-adjusted return on risk-adjusted capital (RARORAC) • Economic Income Created • Risk-adjusted return – (Hurdle rate x economic capital) • Shareholder Value • Shareholder value (SHV) • Discounted value of cash flows • Shareholder value added (SVA) • Discounted value of EVA (Economic Value Added)
Financial Risk Management Metrics • Interest Rate Sensitivity Measures • Duration and convexity • Interest Rate Models • Value-at-Risk (VaR) • Parametric • Monte Carlo simulation • Historical simulation • Asset/Liability Management (ALM)
Value at Risk - A Definition • Value at risk is a statistical measure of possible portfolio losses • A percentile of the distribution of outcomes • Value at Risk (VaR) is the amount of loss that a portfolio will experience over a set period of time with a specified probability • Thus, VaR depends on some time horizon and a desired level of confidence
Value at Risk - An Example • Let’s use a 5% probability and a one-day holding period • VaR is the one day loss that will be exceeded only 5% of the time • It’s the tail of the return distribution • In the example, the VaR is about $60,000
First - Identify the Market Factors • There are three methods to calculate VaR, but the first step is to identify the “market factors” • Market factors are the variables that impact the value of the portfolio • Stock prices, exchange rates, interest rates, etc. • The different approaches to VaR are based on how the market factors are modeled
Methods of Calculating VaR • Historical simulation • Apply recent experience to current portfolio • Variance-covariance method • Assume a normal distribution and use the statistical properties to find VaR • Monte Carlo Simulation • Generate scenarios to determine changes in portfolio value
Based on these 10 lowest returns out of 100 of a simulation of asset value, what is the 95% VaR? A) 19,536,917 B) 13,558,569 C) 11,964,744 D) 9,975,605 E) None of the above
Current State of Financial Risk Management • Modeling is used extensively in measuring market risk • Interest rate sensitivity measures depend on cash flow models and term structure models • Value-at-Risk measures also depend on models • Don’t be fooled by indicated precision of measures • Understand the models underlying the calculations
Operational and Strategic Risk Analytics • Analytic methods are primitive • Top-Down Approaches • Analogs • Remove identifiable risks first • Remaining risk is classified as operational risk • Historical loss data • Bottom-Up Approaches • Self assessment • Cash flow model
Solvency Related Risk Measures • Probability of Ruin • Shortfall Risk • Value-at-Risk (VaR) • Expected Policyholder Deficit (EPD) or Economic Cost of Ruin (ECOR) • Tail Value at Risk (Tail VaR) or Tail Conditional Expectation (TCE) • Tail Events
Performance Related Risk Measures • Variance • Standard Deviation • Semi-variance and Downside Standard Deviation • Below-target-risk (BTW)
Conclusion • There is a standard approach for dealing with each type of risk • Each area has its own terminology and techniques • The ERM challenge is to combine these different approaches into a common method that can deal with risk in an integrated manner • The first step is to understand the different approaches
Acknowledgements • Frank Strenk, Lockton Companies • James Lam • Mark Vonnahme, Department of Finance, U of I
What’s Next? • Thursday, April 26 • Case 3 • Tuesday, May 1 • Course summary and review for the final exam Final Exam Both 8:30 am and 10 am sections Friday, May 4, 2007 8-11 am 120 Architecture Building Conflict exam 8-11 am Monday, May 7 – location TBA