Download
1 / 33
330 likes | 535 Views
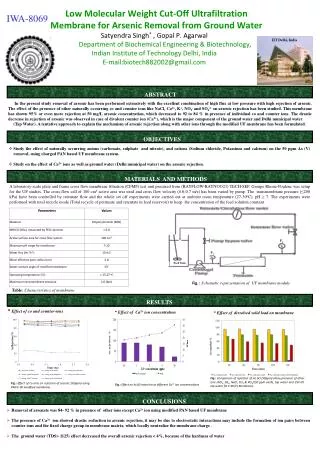
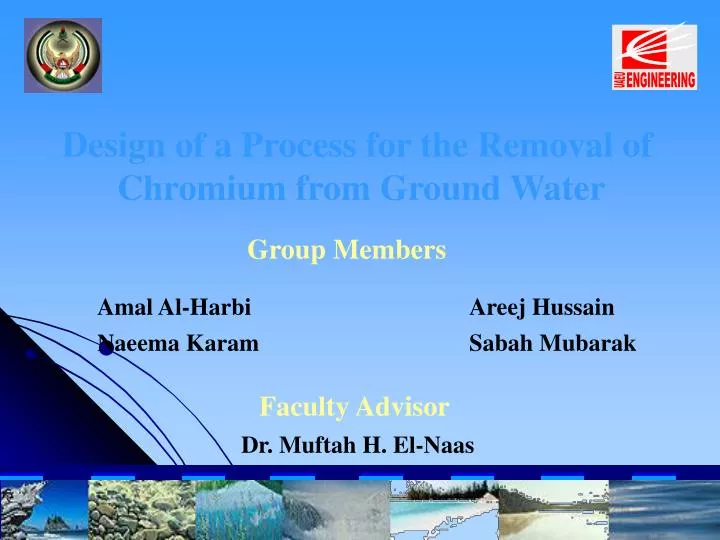
ENGINEERING. UAEU. Design of a Process for the Removal of Chromium from Ground Water. Group Members. Amal Al-Harbi. Areej Hussain. Naeema Karam. Sabah Mubarak. Faculty Advisor . Dr. Muftah H. El-Naas. ENGINEERING. UAEU. Design of a Process for the Removal of

E N D
ENGINEERING UAEU Design of a Process for the Removal of Chromium from Ground Water • Group Members • Amal Al-Harbi • Areej Hussain Naeema Karam • Sabah Mubarak • Faculty Advisor • Dr. Muftah H. El-Naas
ENGINEERING UAEU Design of a Process for the Removal of Chromium from Ground Water • Group Members • Amal Al-Harbi • Areej Hussain Naeema Karam • Sabah Mubarak • Faculty Advisor • Dr. Muftah H. El-Naas
Outline Introduction Adsorption Experiments Process description and material balance Process design Cost estimation Environmental impact Conclusions
Introduction The UAE is one of the world’s biggest consumers of water Sources of water supply in the UAE • Ground water • Desalinated water • Recycled sewage water Ground water accounts for about 30% of drinking water
Problem Definition What is the problem in Al-Ain Ground Water? The Northern Region Wells in Al-Ain are highly contaminated with Chromium. The high concentrations of Chromium led to the closure of 40 wells in this region. • Dry desert climate • Pumping more water • Dissolving of Cr from soil and rock of the adjoining area
Chromium Exists in hexavalent Cr(VI) and trivalent Cr (III) forms Hexavalent form is more toxic than trivalent Source of Cr: • Human activities • Industrial effluent Effect of Cr onhealth: • Cancer in digestive tract and lungs • Nausea and Vomiting The maximum allowable concentration of Cr in drinking water according to EPA and national standards is 0.05 mg/L
Objective The main objective of this project is to design an economical and practical process for the removal of chromium from contaminated water
Adsorbent (68.26 kg/hr Date pits) Material Balance Groundwater (9m3/hr, 9000 kg/hr) 0.11ppm of Cr) Clean water (8.98 m3/hr, 8983 kg/hr with 0.029ppm Cr) Date pits wet cake (68.26 kg/hr date pits contaminated with Cr) 17 kg/hr of water Treatment process (Three main units with six stages
Date Pits Date Pits Contaminated ground water Date Pits Date Pits Contaminated ground water Clean water Wet cake Wet cake Date Pits Date Pits Contaminated ground water Process description
Date Pits Contaminated water H cylinder H dish Design of adsorption vessel
Experimental Work • Materials: • Date Pits. • Activated Date Pits • Algae (Chlorella Vulgaris). • Equipment: • pH meter. • Shaker. • AtomicAdsorption Spectrophotometer (AAS). • Membrane syringe filters. • Preparation of solutions. A stock solution of Cr (VI) (1000 ppm) was prepared in distillate water with K2Cr2O7.
Results and discussion 1. Effect of contact time: Figure 1.1: Effect of contact time on Cr removal using Date Pits and Algae (Initial Cr concentration of 5 ppm; Adsorbent concentration of 6 g/l;pH 2).
Results and discussion 1. Effect of contact time Figure 1.2: Effect of contact time on Cr removal using Activated Date Pits (Initial Cr concentration of 5 ppm; Adsorbent concentration of 1 g/l;pH 2)
2. Modeling of Adsorption kinetics The time influence was modeled by using two models for different adsorbents as follow: • Pseudo first order model: Where: qe : The sorption capacities at equilibrium, (mg/g). qt : The sorption capacities at time t, (mg/g). k1: The rate constant of pseudo first order sorption, (1/min).
2. Modeling of Adsorption kinetics • Pseudo second order model: Where qe: The sorption capacities at equilibrium, (mg/g). qt: The sorption capacities at time t, (mg/g). k: The rate constant of pseudo second order sorption, (g/mg.min).
Table 2.1. The pseudo first and second orderparameters with R2. Sorbent C0(ppm) Pseudo-First Order Pseudo-Second Order
3. Effect of pH Figure 3.1: Effect of pH on Cr removal; Algae concentration of 6g/l.
3. Effect of pH Figure 3.2:: Effect of pH on Cr removal; Date Pits concentration of 6g/l.
3. Effect of pH Figure 3.3:: Effect of pH on Cr removal; Date Pits concentration of 6g/l.
4. Adsorption isotherm The isotherm behaviors of different adsorbents were modeled using Langmuir equation as follow: Also the isotherm were modeled using Freundlich equation presented as follow: Where qmax: The maximum uptake. b: The theoretical monolayer sorption saturation capacity. kf and n: Are Freundlich constants.
Table 4.1. Langmuir and Freundlich constants with R2. Sorbent Langmuir constants Freundlich constants
Groundwater experiments The real groundwater experiments were conducted using adsorbent concentration of 2g/L, and the samples were shaken for two hours to reach the maximum percentage removal as obtained in previous experiments. The experiments showed that: • The effect of pH on Chromium removal at very low concentrations (0.08 to 0.42 ppm) was not as important as for high concentrations (1,5 ppm). • The removal at pH (7-8) and pH 3reaches 71%, 78% using Activated Dates Pits for initial concentration of 0.32. Hence, no need for pH adjustment.
Cost Estimation Total production cost = 160,170.53 Dhs Production cost = 2.17 Dhs /m3
Equipment Cost Ce= C*Sn Where Ce= purchased equipment S= characteristic size parameter size in units . n= index for type of equipment Example Tanks # of tanks =6 Cost (1998) = 6*2400*30.6 =278,37.82 $ Cost (2003) = 109,961.59 Dhs
Environmental Impact Assessment Example of wells concentrations with actions 1(very low)-----------5(severe)
Conclusions • The optimum pH for the removal of Cr(VI) ion by the three adsorbents is around 3. The maximum removal of Cr(VI) was found to be around 76 % for Algae, 74 % for Date Pits, and 99 % for Activated Date Pits . The maximum removal reaches equilibrium stage after one hour for the three adsorbents. • The pseudo-second order model provides the best correlation of the rate data.
The optimum concentrations were 0.2, 0.02 and 0.02 (g/L) for Algae, Date Pits and Activated Dates Pits, respectively at different initial concentration of Cr solution. Also it was found that more advantageous results were obtained with Activated Date Pits compared to the results obtained with raw Date Pits. • The date pits was selected for real ground water treatment
Life is made of water Don’t waste it