Download
1 / 4
40 likes | 120 Views
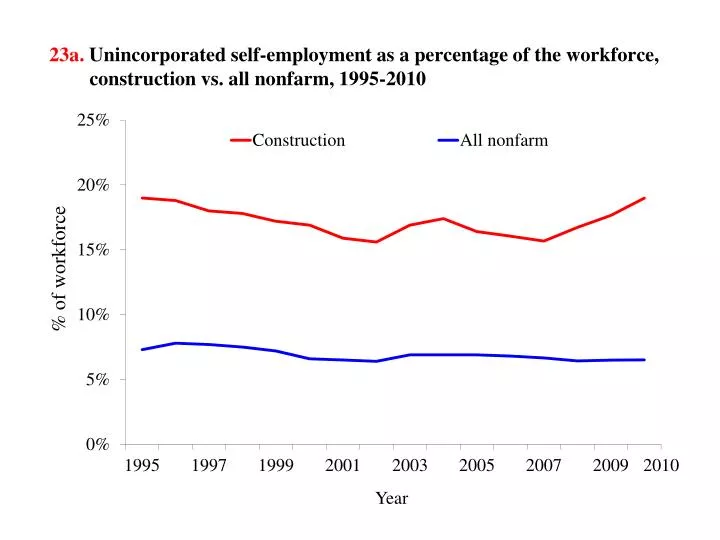
23a . Unincorporated self-employment as a percentage of the workforce, construction vs. all nonfarm, 1995-2010. 2010. 23b . Percentage of self-employed workers, selected construction occupations, 2010. 55%. 44%. 43%. 42%. 27%. 26%. 26%. 21%. 21%. 21%. 20%. 20%. 18%. 18%. 17%.

E N D
23a.Unincorporated self-employment as a percentage of the workforce, construction vs. all nonfarm, 1995-2010 2010
23b. Percentage of self-employed workers, selected construction occupations, 2010 55% 44% 43% 42% 27% 26% 26% 21% 21% 21% 20% 20% 18% 18% 17% 16% 14% 12% 9% 9% 3% 1% 28%
23c. Number of individual proprietorships in construction, 2002-2010
23d. Employee misclassification legislation, by state, 2010-2011