Download
1 / 10
110 likes | 301 Views
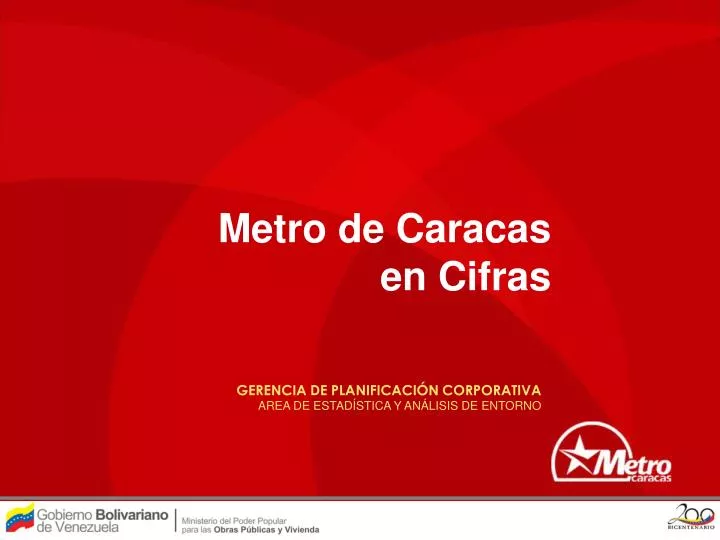
Metro de Caracas en Cifras. GERENCIA DE PLANIFICACIÓN CORPORATIVA AREA DE ESTADÍSTICA Y ANÁLISIS DE ENTORNO. Años. Sistema. Línea 1. Línea 2. Línea 3. Línea 4. 1983. 55.510.381. 55.510.381. 1984. 80.592.828. 80.592.828. 1985. 95.224.972. 95.224.972. 1986. 119.662.155.

E N D
Metro de Caracasen Cifras GERENCIA DE PLANIFICACIÓN CORPORATIVA AREA DE ESTADÍSTICA Y ANÁLISIS DE ENTORNO
Años Sistema Línea 1 Línea 2 Línea 3 Línea 4 1983 55.510.381 55.510.381 1984 80.592.828 80.592.828 1985 95.224.972 95.224.972 1986 119.662.155 119.662.155 600.000.000 1987 146.410.457 142.198.584 4.211.873 1988 218.498.249 195.478.254 23.019.995 500.000.000 1989 259.931.397 215.868.677 44.062.720 1990 281.445.419 238.306.695 43.138.724 400.000.000 Pasajeros Transportados 1991 304.504.271 258.079.844 46.424.427 1992 311.525.428 263.535.681 47.989.747 300.000.000 1993 296.522.969 249.489.029 47.033.940 1994 271.291.534 227.079.214 43.876.898 335.422 200.000.000 1995 289.342.540 229.682.364 44.530.852 15.129.324 1996 288.030.141 225.026.344 45.107.274 17.896.523 100.000.000 1997 285.289.570 223.725.447 43.779.468 17.784.655 0 1998 274.394.425 214.296.835 41.671.916 18.425.674 1999 253.997.323 199.156.698 36.809.571 18.031.054 1983 1984 1985 1986 1987 1988 1989 1990 1991 1992 1993 1994 1995 1996 1997 1998 1999 2000 2001 2002 2003 2004 2005 2006 2007 2008 2009 2000 275.654.877 215.789.837 39.876.597 19.988.443 Años 2001 292.462.949 228.509.453 43.293.459 20.660.037 2002 295.895.692 230.669.335 44.429.039 20.797.318 2003 319.347.272 248.279.842 48.464.273 22.603.157 2004 370.763.652 286.782.991 57.889.625 26.091.036 2005 394.652.318 304.930.255 61.655.571 28.066.492 2006 426.959.766 323.683.547 66.410.655 31.362.870 5.502.694 2007 481.227.854 355.975.125 75.573.414 37.501.446 12.177.869 Sistema Línea 1 Línea 2 Línea 3 Línea 4 2008 510.202.634 375.654.431 79.667.501 41.243.538 13.637.164 2009 484.614.454 77.873.369 353.667.784 13.192.605 39.880.697 Total de Pasajeros Transportados por año Serie Histórica SISTEMA METRO Fuente: Gerencia Ejecutiva de Transporte Metro. Apoyo Técnico
Meses Línea 1 Línea 2 Línea 3 Línea 4 PDL L1 PDL L2 PDL L3 PDL L4 25.348.439 5.807.484 2.905.546 1.035.693 996.440 222.294 113.524 40.129 Ene 26.914.758 3.605.621 5.862.200 1.051.455 151.511 45.541 247.554 1.161.186 Feb 3.987.976 29.152.213 6.369.746 1.201.086 1.051.269 226.548 43.390 141.255 Mar 1.135.769 6.143.547 3.876.899 Abr 1.176.576 248.364 28.005.403 155.202 47.270 1.285.438 6.860.959 4.303.375 May 31.278.973 35.000.000 1.400.000 30.000.000 1.200.000 25.000.000 1.000.000 20.000.000 800.000 Promedio Día Laboral Total de Pasajeros Transportados 15.000.000 600.000 10.000.000 400.000 5.000.000 200.000 0 0 Ene Feb Mar Abr May Meses Línea 4 Línea 3 Línea 2 Línea 1 Promedio Día Laboral Línea 4 Promedio Día Laboral Línea 3 Promedio Día Laboral Línea 2 Promedio Día Laboral Línea 1 Total de Pasajeros Transportados vs promedio día laboral Año 2010 SISTEMA METRO Fuente: Gerencia Ejecutiva de Transporte Metro. Apoyo Técnico
Promedio Total Años Metrobús Día Laboral 1988 11.383.754 33.255 1989 11.150.767 37.238 1990 15.218.611 49.372 200.000 40.000.000 1991 26.553.175 88.490 35.000.000 1992 31.514.937 104.483 1993 29.105.746 96.243 150.000 30.000.000 1994 30.213.757 100.280 Promedio Día Laboral Total Pasajeros Línea 25.000.000 1995 34.261.343 111.357 100.000 20.000.000 1996 36.916.464 120.805 1997 34.285.463 112.457 15.000.000 1998 29.183.753 97.938 50.000 10.000.000 1999 22.034.432 74.100 5.000.000 2000 22.224.017 74.177 0 0 2001 21.323.332 70.650 2002 20.359.734 67.950 1988 1990 1992 1994 1996 1998 2000 2002 2004 2006 2008 2003 24.075.461 79.157 Años 2004 27.813.579 88.786 2005 27.095.489 80.925 2006 23.673.301 73.499 2007 20.174.050 65.549 Total Metrobús Promedio Día Laboral 2008 24.053.439 78.662 82.352 25.032.959 2009 Total de Pasajeros Transportados por AñoSerie Histórica METROBUS Fuente: Gerencia Ejecutiva de Transporte Superficial.
Año 2010 Total Metrobús Promedio Día Laboral 3.000.000 120.000 Ene 2.111.790 86.731 Feb 2.083.165 92.319 2.500.000 100.000 Mar 2.415.807 89.992 2.000.000 80.000 Abr 2.211.325 93.700 Total Pasajeros Metrobús May 2.533.920 98.717 1.500.000 60.000 Promedio Día Laboral 1.000.000 40.000 500.000 20.000 0 0 Ene Feb Mar Abr May Jun Jul Ago Sep Oct Nov Dic Meses Total Metrobús Promedio Día Laboral Total de Pasajeros Transportados vs. Promedio por día laboralAño 2010 METROBUS Fuente: Gerencia Ejecutiva de Transporte Superficial.
Total de Promedio Años MLT Día Laboral 2008 12.155.492 37.283 2009 13.566.496 41.407 2006 831.466 14.108 2007 5.049.609 16.119 12.500.000 50.000 10.500.000 40.000 8.500.000 30.000 Promedio Día Laboral 6.500.000 Total Pasajeros de la Línea 20.000 4.500.000 10.000 2.500.000 500.000 0 2006 2007 2008 2009 Años Total del Sistema Promedio Día Laboral Total de Pasajeros Transportados por AñoSerie Histórica METRO LOS TEQUES Fuente: Gerencia de Planificación y Control de Gestión C.A Metro los Teques.
Año 2010 Total de Metro Los Teques Promedio Día Laboral Ene 1.038.224 37.137 Feb 1.038.208 41.011 1.172.326 Mar 40.788 36.629 1.130.371 Abr 45.334 1.179.763 May 50.000 1.300.000 40.000 1.100.000 900.000 30.000 Promedio Día Laboral 700.000 Total Pasajeros de la Línea 20.000 500.000 10.000 300.000 100.000 0 Ene Feb Mar Abr May Jun Jul Ago Sep Oct Nov Dic Meses Total de Metro Los Teques Promedio de Día Laboral Total de Pasajeros Transportados vs. Promedio por día laboralAño 2010 METRO LOS TEQUES Fuente: Gerencia de Planificación y Control de Gestión C.A Metro los Teques.
1998 2003 1997 2001 2002 2004 2005 2006 2007 2008 2009 1999 Total 2000 312.810.000 100.000.000 1.140.004.126 289.440.000 115.934.126 182.470.000 101.940.000 37.410.000 L3 (El Valle- La Rin.) 65.470.000 70.380.000 118.630.000 112.650.000 86.980.000 127.000.000 23.838.344 963.808.344 1.630.000 13.360.000 69.190.000 201.390.000 37.870.000 L4 (Capu. - Z Rent.) 35.420.000 166.000 39.757.985 136.803.985 96.880.000 L5 (Plz. Vzla. – Mir.) 419.588.066 125.950.000 98.008.066 195.630.000 Sist. Ccs –Gua –Guat. 220.381.920 86.620.000 123.421.920 Sist. MCable San Ag. 10.340.000 0 23.911.936 Misión Villanueva 23.911.936 Rehab. Línea 1 100.000.000 100.000.000 0 35.420.000 439.736.000 424.872.377 1.630.000 13.360.000 65.470.000 69.190.000 70.380.000 201.390.000 118.630.000 340.720.000 3.004.498.377 112.650.000 86.980.000 750.000.000 700.000.000 650.000.000 600.000.000 550.000.000 500.000.000 450.000.000 Línea 4. Tramo Capuchinos - Zona Rental Línea 3. El Valle - La Rinconada Línea 5. Tramo Plaza Venezuela - Miranda Millones de US$ 400.000.000 Rehabilitación Línea 1 Sistema Metro Cable San Agustín Sistema Caracas - Guarenas - Guatire Misión Villanueva 350.000.000 300.000.000 250.000.000 200.000.000 150.000.000 100.000.000 50.000.000 0 1997 1998 1999 2000 2001 2002 2003 2004 2005 2006 2007 2008 2009 Años Evolución del Desembolso Global Mill. de Us$ de los Proyectos Metro - Serie Histórica Fuente: Gerencia de Control del Proyecto.
Oct Nov Dic Total al mes Ago Sep Feb Mar Abr May Jun Jul Ene Línea 3. El Valle - La Rinconada 10.297.894 0 0 0 0 0 0 0 6.106.995 1.536.082 23.015.082 0 20.256.053 0 0 0 0 0 0 0 Línea 4. Tramo Capu. - Z Rental 195.130 12 0 2.015.713 2.210.855 0 0 0 0 0 0 0 0 5.605.864 0 0 Línea 5. Tramo Plz. Vzla. - Miranda 0 0 0 0 0 0 0 0 0 0 Sistema Caracas – Guar. – Guat. 4.151.174 4.085.699 312.463 6.763.310 0 0 Sistema Metro Cable San Agustín 436.011 0 0 0 0 0 0 0 5.891.267 0 0 0 24.421.161 Misión Villanueva 649.028 10.515.093 13.257.040 0 0 0 0 0 0 0 0 0 0 Rehabilitación Línea 1 261.866.049 9.981.284 0 0 18.913.483 0 0 0 0 0 0 0 291.040.701 8.064.271 278.768.023 27.029.558 0 0 0 0 0 0 0 15.904.665 312.476 354.696.107 174.000.000 168.000.000 162.000.000 156.000.000 150.000.000 144.000.000 138.000.000 132.000.000 126.000.000 120.000.000 114.000.000 108.000.000 102.000.000 Línea 4. Tramo Capuchinos - Zona Rental Línea 3. El Valle - La Rinconada Línea 5. Tramo Plaza Venezuela - Miranda 96.000.000 90.000.000 84.000.000 Millones de US$ Rehabilitación Línea 1 Sistema Metro Cable San Agustín 78.000.000 Sistema Caracas - Guarenas - Guatire Misión Villanueva 72.000.000 66.000.000 60.000.000 54.000.000 48.000.000 42.000.000 36.000.000 30.000.000 24.000.000 18.000.000 12.000.000 6.000.000 0 Ene Feb Mar Abr May Jun Jul Ago Sep Oct Nov Dic Meses Evolución del Desembolso Global Mill. de Us$ de los Proyectos Metro - Año 2010 Fuente: Gerencia de Control del Proyecto.
Km. DE RED 140 121,9 120 100 80 66,3 60 45,6 66,3 40,0 40 45,6 40,0 26,7 20 12,3 0 1.984 1.986 1.988 1.990 1.992 1.993 1.995 1.997 1.999 2.001 2.003 2.005 2.007 2.009 2.011 2.013 AÑOS Evolución de la Red Metro y crecimiento Desde 1984 hasta 2013