Download
1 / 22
220 likes | 228 Views
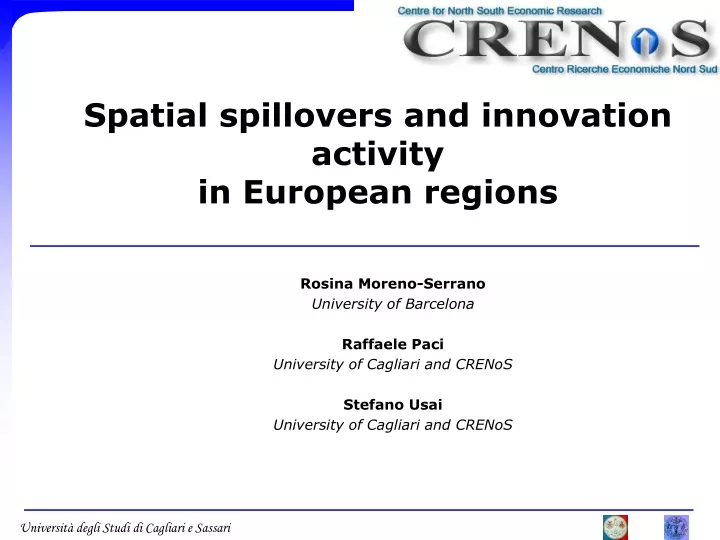
Spatial spillovers and innovation activity in European regions. Rosina Moreno-Serrano University of Barcelona Raffaele Paci University of Cagliari and CRENoS Stefano Usai University of Cagliari and CRENoS. Aims of the paper.

E N D
Spatial spillovers and innovation activityin European regions Rosina Moreno-Serrano University of Barcelona Raffaele Paci University of Cagliari and CRENoS Stefano Usai University of Cagliari and CRENoS
Aims of the paper • Explore the evolution of technological activity across European regions and the determinants of innovation diffusion and creation • Estimate a Knowledge Production Function (KPF) where innovation output is function of R&D, and other internal and external factors. • Use the spatial econometric methodology to define the correct specification of the KPF and to assess the role of several types of spillovers. • Analyse the importance of geographical proximity (both within and across national borders) in the diffusion of knowledge. • Explore the role played by similarity of the technological composition between two regions in the diffusion of knowledge.
The literature behind us/1 • From a theoretical point of view: knowledge and technological progress are engines of economic dynamics in most endogenous growth models (since Romer, 1986). • In the spatial context this implies that local growth depends on the amount of technological activity which is carried out locally and on the ability to exploit external technological achievements known as technological spillovers (Martin and Ottaviano, 2001; Coe and Helpman, 1995). • Importance of geographical proximity for sharing innovations and knowledge and other local advantages (Glaeser et al, 1992; Henderson, 1997, Paci and Usai, 2000, Breschi and Lissoni, 2000) • Importance of other types of proximity and links for technological spillovers to operate (Boschma, 2005, Coe, Helpman and Hoffmaister, 1997, Keller, 2000, Verspagen, 2000)
The literature behind us/2 • A useful approach to analyse the process of innovation creation is the estimation of a KNOWLEDGE PRODUCTION FUNCTION (KPF) • originally formalised by Griliches, 1979, and mainly applied at the firm level. • It has been refocused by Jaffe, 1989, to study the geographic scope of knowledge spillovers through citations. • Empirical estimations of KPF have been carried out for different levels of aggregation: • For the US case (Acs et al, 1994; Audretsch and Feldman, 1996; Anselin et al, 1997, Feldman and Audretsch, 1999) • For the EU case: Maurseth and Verspagen, 1999; Bottazzi and Peri, 2003).
CRENoS database on innovation activity • Updated statistical databank on regional patenting at the European Patent Office • Patent applications • 1978-2001 • 17 countries in Europe (the 15 members of the pre-2004 EU plus Switzerland and Norway) • 175 regions (inventors residence) • Up to 100 (3digit ISIC) manufacturing sectors
Spatial distribution of innovation Early eighties: • strong centre-periphery distribution of innovation activity Late nineties: • the intensity to innovate has increased considerably over the two decades in all countries • the innovations have been spreading to some more regions in the South of Europe (Spain, Southern Italy and Finland) • the degree of disparities in the regional distribution of innovative activities has decreased
Map 1. Distribution of innovative activity in European regions, (patents per capita, annual average) 1981 - 1983 1999 - 2001
Spatial dependence of innovative activity Presence of a strong and positive spatial autocorrelation process in the innovative activity among contiguous areas
Map3. Scatter for innovative activity in the European regions, 1999-01 (patents per capita, annual average; number of regions in parenthesis )
The determinants of innovative activity the main determinants of the local process of innovative activity are on a blend of: internalfactors - production factors (R&D) - externalities within the region (agglomeration economies, knowledge not codified, institutions) externalregionalfactors (spillovers through trade across sectors, common markets for skilled labour,…).
Estimation strategy • OLS to check for the presence of spatial dependence (R&D, control variables) • If any, ML estimation of spatial dynamic models (spatially lagged dependent variable, spatially lagged R&D) • Check for different weight matrices (contiguity, distance)
Basic regression • I = patents per capita (annual average 1999-2001) • RD = share of GDP devoted to R&D (1989-96) • DENS = density of population(1997-99) • MAN = share of manufacturing employment (1997-99) • NAT = national dummies • Extensions: • Spatial lag dependent variable • Spatial lag R&D with distance decay effects • Spatial spillovers within and across national borders • Spatial spillovers and technological similarities
Estimation of innovative activity. Dependent variable: Log (I).
Innovative activity with distance decay effectDependent variable: Log (I).
Innovative activity within and across countriesDependent variable: Log (I)
Technological proximity WTech: matrix calculated by means of patent application data (1978-01) disaggregated into 101 sectors (energy and manufacturing, 3-digit Ateco91) for each region, where fik is the share of a particular patent class k in the total of patents of region i. Pij equal to unity for regions whose technological characteristics are identical Pij is zero for regions whose vector of characteristics are orthogonal The closer to unity the greater the degree of similarity of the two regions’ technological structure is. The spatial lag of patents constructed with this weight matrix, would imply a weighted sum of other regions’ patents with weights proportional to the proximity of the firms in technological space
Innovative activity with tech-distance matricesDependent variable: Log (I).
Summary of main results/1 • Importance of internal R&D expenditure on innovation activity, with a highly significant and stable coefficient. • Important role played by other internal factors reflecting agglomeration economies and national characteristics. • Presence of spatial association and necessity to take into account innovation spillovers arising from other regions both through patenting activity and R&D efforts. • Such spatial spillovers decay with distance: strong impact of the 1st and 2nd order neighbours, or, using distance, up to 250 kilometres.
Summary of main results/2 • Knowledge spillovers occur mainly between regions of the same country: national innovation systems seem to dominate the European one. • Technological similarity between two regions positively influence innovation spillovers with a magnitude comparable to geographical proximity. • Thus, interregional knowledge spillovers exist between regions which are “close” both geographically and technologically.