Download
1 / 30
300 likes | 456 Views
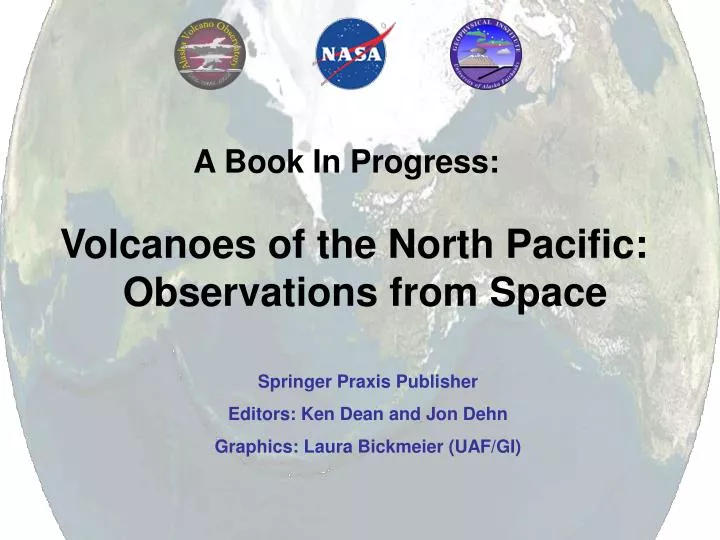
Volcanoes of the North Pacific: Observations from Space. A Book In Progress:. Springer Praxis Publisher Editors: Ken Dean and Jon Dehn Graphics: Laura Bickmeier (UAF/GI). Introduction:. North Pacific region Location: Northern Ring of Fire & Pacific Plate Subduction Zone

E N D
Volcanoes of the North Pacific: Observations from Space A Book In Progress: Springer Praxis Publisher Editors: Ken Dean and Jon Dehn Graphics: Laura Bickmeier (UAF/GI)
Introduction: North Pacific region Location: Northern Ring of Fire & Pacific Plate Subduction Zone 150 Active Volcanoes: Activity detected almost daily Geographic Area: Kamchatka Peninsula and the Kurile Islands Aleutian Islands, Alaska Peninsula, Mt. Wrangel & Cascades
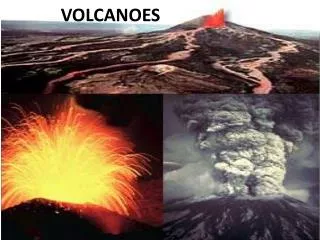
Why the North Pacific Region • 150 active volcanoes in the region • All types of eruption processes are observed: • explosive, effusive, strombolian, phreatic and dome • Activity is observed almost daily • Remote Sensing a primary tool used to monitor • Largest archive of satellite data of eruptions • All satellite data types: AVHRR, MODIS and SAR • Multiple geophysical data for comparison (seismic, geodetic, geologic)
Book Organization • Section I: Eleven Chapters • Describing sensors, techniques, applications & significance • Section II: Atlas Images Showing • Explosive, strombolian, dome, phreatic, eruptions, volcanic landscapes at various wavelengths • Section III: Appendix • Operational Manual used by AVO to train analysts & students • Section IV: DVD • Additional images not shown in the atlas section • Raw data samples with custom analysis software from ENVI • Animations
TABLE OF CONTENTS: Section I: ChaptersEach has multiple authors • Chapter 1: Complexities of Observing Remote Volcanoes • Chapter 2: Satellite Systems and Interactions • Chapter 3: Thermal Anomalies at Volcanoes • Chapter 4: Morphology and Chemistry of Volcanic Deposits • Chapter 5: Imaging of Volcanic Plumes • Chapter 6: Gas Emissions from Volcanoes • Chapter 7: Volcanic Cloud Dispersion Models • Chapter 8: Radar Imagery and Volcano Monitoring (InSAR) • Chapter 9: Real Time Operational Satellite Monitoring • Chapter 10: Manned Missions Capturing Volcanic Activity • Chapter 11: Regional and Global Impacts of Volcanism
Chapter 1: Introduction Purpose: Book background and purpose Chapter 2: Satellite Systems and Interactions Purpose: EM Spectrum and interactions with volcanoes
Chapter 3: Thermal Anomalies at Volcanoes -90.8 °C 0.0 °C 49.9 °C Purpose: Detect and analyze thermal anomalies and relate to surface processes Sensors: TIR Bands GOES B2 (NA at high latitudes) AVHRR B3 (3.5 - 3.9 mm; 1 km) MODIS B20 – 25 (3.7 – 4.6 mm; 1 km) Landsat TM B6 (10.4-12.5 mm; 90-120 m) ASTER B9 – 14 (2.4-11.7 mm; 90 m) Significance Increased volcanic activity Effusive eruptions Precursor to explosive eruption Okmok V., 1997 22 hot pixels with Tmax 49.9°C 3 recovery pixels
Chapter 3: Thermal Anomalies at Volcanoes Volcanic Sources: Exposed vent Lava Hot domes Hot debris flows Hot lahars Pyroclastic flows Geothermal lakes Strombolian Eruption Lava & Debris Flow Dome & Hot Avalanche
Chapter 4: Morphology and Chemistry of Volcanic Deposits Purpose: High spatial resolution data and how it relates to low resolution satellite signals Sensors: High spatial res., Vis. – TIR Landsat TM: 15 - 120 m ASTER: Spatial: 15 – 90 m (+ DEM) Significance: Understanding of eruption processes Bezymianny Volcano 2000: Dome and hot debris flows (white is hot). Image courtesy of M. Ramsey (U. Pitt.)
Chapter 5: Imaging of Volcanic Plumes MODIS 29-32 -20 to 5 Purpose: High temporal resolution data to detect, track and analyze airborne ash Sensors: High temporal resolution, TIR GOES B4 & 5 (0.5 – 12.5 mm; 4-8 hi la.) AVHRR B4 & 5 (0.6 – 12.4 mm; 1km) MODIS B28 - B36 (7.2 – 14.4 mm; 1km) Significance: Aircraft encounters (stall engines) Health problems Impact to on cities (ash fall) Eruption cloud Mt. Cleveland, Alaska 19 Feb. 01, 2310 UTC * Image courtesy of D. Schneider, AVO
Chapter 6: Gas Emissions from Volcanoes Purpose: Detection and analysis of Gases, primarily SO2 Sensors: High temporal resolution, UV & TIR TOMS MODIS B28 - B32 (7.2 – 12.2 mm; 1km) Significance: Precursor to eruptions Climate interactions Cultural impact MODIS bands 29m32 showing SO2 emitted by the eruption of Mt. Cleveland, 19 February 2001 * Image courtesy of V. Realmuto, I.M. Watson of JPL
Chapter 7: Volcanic Cloud Dispersion Models Mt. Spurr, Alaska September 1992 Purpose: Predicting the movement of volcanic clouds for hazard mitigation Models: Puff, Hysplit, CANERM Significance: Predictions not limited by cloud cover or timing of satellite passes
Chapter 8: Radar Imagery and Volcano Monitoring (InSAR) Purpose: Monitoring of deformation and how this relates to eruptions Sensors: SAR ERS 1 & 2 RadarSat Significance: Precursor signal of activity Insight into sub-surface processes Deformation of Mt Peulik Volcano, Alaska Each fringe = 2.83 cm of deformation 6 fringes = 17 cm of uplift * Image courtesy of Z. Lu (USGS)
Chapter 9: Real Time Operational Satellite Monitoring * Image courtesy of AVO Monitoring and Analysis: Daily (near real-time) Sensors: GOES, AVHRR, MODIS Detection: Volcanic clouds & thermal anomalies Significance: Hazard mitigation & understanding of surface & airborne processes
Chapter 10: Manned Missions Capturing Volcanic Activity • Sensors: • Space shuttle & space station • photographs • Significance: • Different perspective than satellites • May be available in real-time • Space shuttle photorgraph • Simushir Island,Kuriles, Russia • Photo: Astronaut Tom Jones * Image courtesy of P. Mouginis-Mark, UH
Chapter 11: Regional and Global Impacts of Volcanism Purpose: Effects of catastrophic eruptions on a global scale. Recent examples: Mount St. Helens in 1980 and Mt. Pinatubo in 1992. Significance: World weather and climate Agriculture Acid rain World health Mt. St. Helens Crater, 1980 Global, stratospheric circulation of SO2 from the eruption of Mt. Pinatubo 1992 * Images courtesy of California State University Fullerton and Suffolk Community College
The Atlas & DVD Veniaminof Volcano: Eruption and ice interactions Purpose: Exemplify the use of satellite data for volcanic processes. Examples include: Analysis techniques Most types of satellites, images and other geophysical data A variety of eruption types Picturesque images
The Atlas& DVD Eruption plume and lahars at Augustine Volcano, Alaska, 1986 Landsat image One of the first Landsat images of an eruption * Sample page courtesy of Ken Dean, AVO.
The Atlas& DVD Volcanic plume at Kliuchevskoi Volcano, Kamchatka, 1994 AVHRR image * Image processing by Kevin Engle
The Atlas& DVD Volcanic plume from Mt. Spurr Alaska, 1992 AVHRR image One of these plumes drifted 10,000 km to Greenland R Emanuel, 8/19/92 R. McGimsey,, 8/18/ 1992 T P Miller, USGS, 7/3/92
The Atlas & DVD Plume Evolution + 13 hr + 13 hr AVHRR: Single Band (B4) AVHRR: Split Window B4 minus B5 Plume becoming translucent Clear ash signal
The Atlas & DVD Movement of volcanic ash Time series of GOES images Mt. Cleveland V. Alaska, 2001. Ash tracked for 3 days
The Atlas & DVD Thermal anomalies in a vent at Shishaldin Volcano, Alaska, 1999 AVHRR images and model of activity First observation of magma rising in a vent
The Atlas & DVD 9 Feb. 1 Mar. 7 Mar. R. McGimsey, 23 April 1999 Plume & Thermal Anomalies Photograph and AVHRR images draped on DEM Shishaldin, Alaska, April 1999: Thermal anomalies led to an explosive eruption in April
The Atlas & DVD Lava Flow AVHRR, SAR, Landsat, FLIR Okmok V., Alaska, 1997 First detected by satellite data
The Atlas& DVD Hot debris flow From a dome Landsat image One of the most active volcanoes in the region Kliuchevskoi V. Stratovolcano and Bezymianny V. Stratovolcano & dome Eruption: 2000
The Atlas& DVD Multiple cinder cones and lava flows at Plosky Tolbachik Volcanic Complex, Kamchatka, Russia Radarsat image Eruption: 1975-76
Lava dome and lava flows at Krasheninnikov Stratovolcano with calderas & craters Radarsat Image Eruption: 500 BP The Atlas& DVD
The Atlas& DVD Lava flows at glacier capped Westdahl Volcano, Alaska JERS SAR draped on DEM Eruption: 1991-92
Volcanoes of the North Pacific: Observations from Space Publication Date: 2005 Springer Praxis Press