Download
1 / 49
500 likes | 676 Views
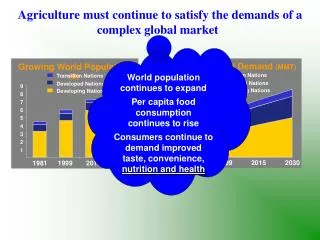
Growing World Population (B). Rising Cereal Demand (MMT). Transition Nations. Transition Nations. Developed Nations. Developed Nations. 9. 3000. Developing Nations. Developing Nations. 8. 2500. 7. 6. 2000. 5. 1500. 4. 3. 1000. 2. 500. 1. 1981. 1999. 2015. 2030. 1981.

E N D
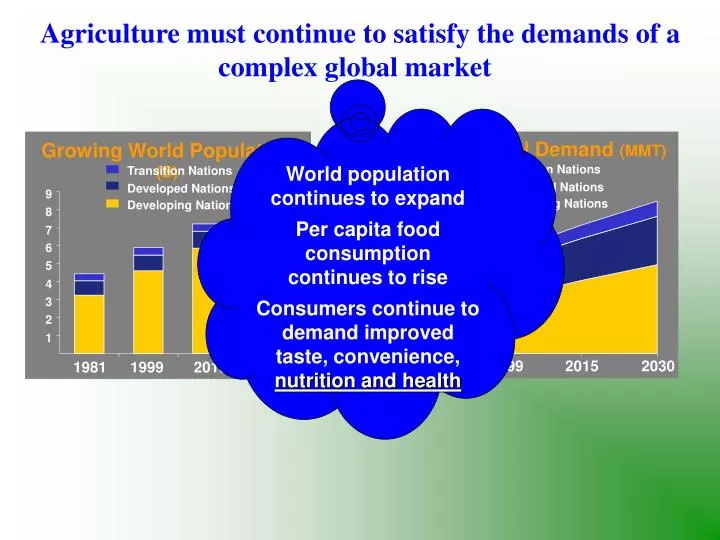
Growing World Population (B) Rising Cereal Demand (MMT) Transition Nations Transition Nations Developed Nations Developed Nations 9 3000 Developing Nations Developing Nations 8 2500 7 6 2000 5 1500 4 3 1000 2 500 1 1981 1999 2015 2030 1981 1999 2015 2030 Agriculture must continue to satisfy the demands of a complex global market World population continues to expand Per capita food consumption continues to rise Consumers continue to demand improved taste, convenience, nutrition and health
FOOD OUTLOOK 2020 • World demand for cereals and Meat • million metric tonnes • 1974 1997 2020 • Developed countries664 725 822 • Developing countries 560 1118 1675 • Investments in food securityUS $578.90 billion • Irrigation 174.60 • Rural Roads 120.30 • Education 75.90 • Clean water 86.50 • National Agricultural Research 121.70
Facts on nutrition • Over all number of malnourished children is expected to continue its gradual decrease for 166 million in 1997 to 132 million in 2020 • China’smalnourished children will fall by half • India will experience slow improvement and will remain 3rd of all malnourished children in the developing world • Sub-Saharan Africa is in perilous situation. The malnourished is expected to increase by 6 million for by18% compared with 1997. The region will remain “hot spot” of hunger and malnutrition for years to come IFPRI , 2004
Iron Zinc Range 7–24 16–58 Average green revolution variety 12 22 IR68144 21 34 WHY MICRONUTRIENT DEFICIENCY Nutrition was low priority in crop breeding for improvement of varieties Micronutrient density in rice PPM Khush , 2003
WHY MICRONUTRIENT DEFICIENCY • Food Availability • Maping Index Mapping Typology States • Below 5.0 1. Extremely Low Gujarat • 5.0-6.5 2. Very Low RJ, BH • 6.5-8.5 3. Low MH,HY,KN,WB • 8.5-10.0 4. Moderate UP,HP,AS,TN,OR,AP • Above 10.00 5. High KL,MP,PJ • Indicators • Deficit of food production over consumption • Instability in cereal production • Environmental Sustainability Index • Number of people affected by disasters • Percentage of area affected by drought in the area
WHY MICRONUTRIENT DEFICIENCY • Food Access • Maping Index Mapping Typology States • 0- 5.5 1. Extremely Low BH • 5.5-7.8 2. Very Low MP,TN,MH,OR,WB • 7.8-9.0 3. Low GJ,UP,AP,KL • 9.0-11.2 4. Moderate KN,AS,RJ,HY,PJ • 11.2-12.8 5. High HP • Indicators • Average per consumer unit per day calorie intake (Kcal) of the lowest deciles • Percentage of population consuming less than 1890 Kcal per consumer unit per day. • Percentage of population below the poverty line • Percentage of persons in labour households to the total population • Rural Infrastructure Index • Juvenile sex ratio (Femalesper thousand males in 0-9 years) • Percentage of literate females to total female population • Percentage of SC/ST population to total population
Indicators • Deficit of food production over consumption • Instability in cereal production • Environmental Sustainability Index • Number of people affected by disasters • Percentage of area affected by drought in the area Food insecurity Atlas 2002
Traditional Technology • Past success developing countries • Science and Technology underpinned the economic & social gains in countries of South specially ASIA through green revolution(agriculture),white revolution ( milk production ) blue revolution ( marine products) resulted in by increased calorie availability per person 24 percent • the key factors are Scientific discoveries, government policies with respect to credit and farm inputs irrigation , public and private participation and international community initiatives • Increased agricultural productivity, rapid industrial growth and expansion of non farm rural economy contributed to almost tripling of per capita GDP
Strategies Safety • Genetic engineering Safety • Molecular marker assisted breeding Allright • Tissue culture Fine • Biological agents Explain
Stages in Research Development and Commercialization of Transgenic Plants Commercia- lization Discovery Development Biosafety Public acceptance BASIC RESEARCH APPLIED RESEARCH DEVELOPMENT VERI-FICATION AND VALI-DATION BREEDING LINE DEVELOP-MENT FIELD TRIALS VARIETAL REGISTRATION/CERTIFICATION MARKETTING CULTIVATION AND PROCESSING Rs 30m 30m 30m 20m yrs 0 3 5 7 10 Farmers Consumers Trait Gene Tissue culture Gene delivery Transgenics Molecular analysis Seed set and lab testing Green house testing Limited field trials Toxicity and allergenicity and environmental impact Large scale field trials with all India coordination ICAR/SAUs Variety release breeders- foundation- certification of seeds
What Happened and Why Successful Crops % of Acreage Planted to GE Varieties In U.S. in 2003
Thinking in terms stakeholdersthanstock holders Project affected people Individual and families near the project Indigenous groups and their leaders Public sector Local state & National governments Multinational & bilateral development institutions Private sector Project financiers Local business Industry associations KEY STAKEHOLDERS Advocacy Groups Local and National grass roots NGO’s Religious groups University and research centers
concerns • The potential risk to • health of human beings, animals, and environment • social, political and economic relationships • fundamental philosophical, religious or “ metaphysical” value of individuals or groups
Loss of biodiversity Cross-pollination Emergence of superweeds and superbugs Potential increase in use of herbicides Need to increase yields to feed growing population Possibility of reducing need for pesticides, fertilizers Grow more food on same amount of land Environment Pro-GM Anti-GM *Opinions are generalized, and not all opponents or proponents may hold all of these views.
Fear of unknown allergens Spread of anti-biotic resistance Inadequate regulation of new products Greater regulations than other foods Potential benefits to nutrition golden rice enhanced protein content in corn soybean oil with less saturated fat Human Health Anti-GM Pro-GM
Need redistribution, not just more Farmers will not be able to afford expensive seed, ’technology fees’ Developing countries need not have to eat the food others reject Modified seeds will allow farmers to grow more to feed their family and to sell, reducing the need for food aid Public-private cooperation can transfer technology Food Security Pro-GM Anti-GM
Corporations benefit, not those in need Products needed in developing countries are not being developed because the market is not profitable It is wrong to patent life Patents needed because new strains are intellectual property Publicly funded research can benefit the public good Socio-economic concerns Anti-GM Pro-GM
Parameters to transgenics useful in effectiveness of strategies Technology transcending Consumer/farmers views Time Cost -benefit Investment Options and alternatives Precision Safety IPR expertise Success criteria Socio-economic factors Integration with existing strategies Product formulation Product Delivery systems
Activities of different Players Research and DevelopmentPublic Government Regulatorydevelopment Government Technology Transfer Marketing Joint Efforts private sector FARMER CONSUMER
WHAT ARE PUBLIC CONCERNS • The term genetically engineered/ manipulated/modified is uncomfortable • The technology is new and unfamiliar • The technology is difficult to understand • Whether GMOs safe • to environment • to Consumption • What are the benefits from this change
PUBLIC PERCEPTION OF RISK • Negative Campaigns. • Recent regulatory failure. • Communication gap by proponents.
NEGATIVE CAMPAIGNS • Are not being seriously confronted. • Communication between less informed to ignorant perpetuates aberrant meanings. • Propagandists communicate better than proponents. • Media encourages sensational negative views.
TYPICAL CASE • Negative Campaigner FACT • Transgenics do not increase yield. Not True • GMO not suited for sustainable agriculture. False • Insect killing genes destroy beneficial insects also. False • Encourage monopoly Not related to BT • Pollens escape and weeds benefit. False • Approvals for regulated field trial but in practice False commercially growned. (Monitoring)
REGULATORY FAILURES • Incidents shaking public confidence: • Dropsy from contaminated Mustard Oil. • Blood screening failure for HIV. • Spurious seed manufacturers. • Spurious pesticides/fertilisers. • [None involve Biotechnology but all involve major regulatory failure] • PUBLIC OPINION IS BASED ON PERCEPTIONS OF REALITY RATHER THAN ON REALITY ITSELF
SURVEY RESULTS ON FOOD SAFETY- EXAMPLE • Do you fear that branded milk may be adulterated and unsafe to drink? Yes 60% No 13% Can’t say 27% • What is your regular source of milk supply? DMS 12% Mother Dairy 38% Milkman/Private Dairy 50% (Pasteurization ?) Delhiities Say Food adulteration is rampant & the law against it remains only on paper 93% Checking, testing and enforcement machinery must be revamped and strengthened 96% Awareness must be built up among public so that they are also vigilant. 98% Telephonic poll conducted by TNS-MODE among 249 Delhiities on May 31 to June 2.
DEVELOPMENT & TESTING Coordinated Variety Release Committee State variety release committee. Notification by sub-committee on crop standards, release and notification. E Seed Production Foundation Certified Seed Marketing SYSTEM OF VARIETY DEVELOPMENT AND RELEASE Public Sector Variety’s Release Breeder
i) Testing of public variety’s release Certification Seed production Marketing ii) Development and Testing of private sector developed varieties [NO SYSTEM OF RELEASE AND NOTIFICATION THROUGH PUBLIC SECTOR CHANNELS] Seed Production ….. Marketing SYSTEM OF VARIETY DEVELOPMENT AND RELEASE Private Sector Variety’s Release PVP PBR
DBT SYSTEM OF TRANSGENICSRELEASE CHECKS AND COUNTER CHECKS ENVIRON-MENT SAFETY FOOD SAFETY QUARANTINE IBSC -- RCGM -- GEAC REGULATED FIELD TRIALS DATA ANALYSIS, LOCATION TRIALS NBPGR ICAR SEED REGISTRATION LABELLING
Traffic Police FATE OF ILLEGAL GMO TRAFFICKING SMUGGLING GMO’s IS CRIME
Gujarat’s illegal Bt Cotton case MOEF DBT Government of India COMPANY B Quarantine ? Government of Gujarat State Government Seed act COMPANY A
A TYPICAL CASE OF STAKEHOLDERDS INTERACTION - SHAPING THE FUTURE OF TRANSGENICS Media- reported regularly and views of all without wrong interpretations Politicians - wanted protection of farmer interests and punishment of guilty as per Law Central government: want to enforce EPA Act through sate government as per biosafety guidelines Farmers - request to protect their investment and enforce law at the same time Public general: getting information and are more concerned for the future Scientists : want to set an example by punishing the guilty to set an example Consensus is building on to protect farmers interest, punish guilty and ensure maximum safety to environment with relatively low risk
Private character of biotechnology A CONCERN • In the late 1970s the top 20 pharmaceutical companies collectively had about 5 percent of the global pharmaceutical market. If you look at it today, they have over 40 percent of the global pharmaceutical market. • We didn’t pay much attention to veterinary medicines 20 years ago, but today the top 10 have about 60 percent of the global market in veterinary medicines
Private character of biotechnology A CONCERN • In 1979 there were 7000 public and private seed institution.s. Not even one company occupied significant percentage of global commercial seed market. Today 10 companies control in excess of 1/3 of global commercial seed market. • In the late 1970s, there were 65 companies that were inventing and marketing crop chemicals-- herbicides, insecticides, nematicides and so on . Now we’re down to nine companies that make up about 91 percent of the global market.
Agriculture biotechnology Market Shares 1999 Du Pont Aventis 3% Syngenta 7% 5% BASF 5% Monsanto 80%
NOT ONLY GEPS ? LEHAR WHEAT SOAPS FLOUR WIMPY CLOTHES HONDA ALOO Mc DONALDS BHUJIA FORD DOMINOS COMPUTERS COSMETICS CELLO PHONES ICECREAMS PIZZA KENTUCKY CHICKEN WIPRO WTO CODEX CBD TRIPS
DESCRIPTION OF TRADITIONAL FARMER • Illiterate • Small and Marginal • Subsistence farming • No Money for inputs • Low risk bearing ability
DESCRIPTION OF MODERN FARMER • Politically proactive • Moderately literate -- 1951 (18%), 1991(33-75%) • Access to TV, phone and modern transport • Awareness level • Moderately conscious
Brand Preferences of Consumer Goods Reflect Public Acceptance for New Products
CHANGING RURAL LIFESTYLE Spending on Consumables excluding grains Rs. 202-441/- PM (Average Rs. 270/- PM) PENETRATION OF • Necessary products (Toilet soaps,Washing cake, Tea) 60-91% • Share of total consumption (Toilet soap, Washing cakes, Blades) 50% • Creams, Shampoo, Powder 20-54%
CONTRASTING AGRICULTURE SCENARIO USA INDIA No of farm families 0.9m 105M Average size of farm 200 Ha < 2ha Share in workforce <2% >64% Contribution to GDP 1.7% 26%
Farmers are politically proactive, audio visual literate and eager to adopt new biotechnologies “ I DO NOT UNDERSTAND WHY YOU ARE ALL FIGHTING . WE HAVE TRUST IN OUR SCIENTISTS AND LEARNED PEOPLE . WHEN YOU CAN ARRANGE MODERN DANGEROUS ARMS TO SOLDIERS, WHY CAN NOT YOU PROVIDE MODERN TOOL AND TECHNIQUES TO FARMERS TO INCRASE PRODUCTIVITY . PLEASE DO NOT DELAY. WE CAN DECIDE THE FATE OF TECHNOLOGY IN NO TIME“
IMPACT OF BT COTTON IN CHINA Estimated area : 1997 4491000 HA 1998 4459000 HA 1999 3736000 HA Percentage surveyed Farmers: 1- 85.6 Control plants Boll worm resistant and susceptible Bt varieties CAAS (Chinese Academy of Agricultural Sciences) and Monsanto- DPL (MDP) varieties Yield : seed cottonBt Non Bt St deviation Mean Kg/Ha 3426-3495 2841-3700 550-585
COST OF SEED COTTON PRODUCTION ( RMB ) NonBt RMB /Kg 3.99-4.45 BT ! RMB /Kg 2.68-3.19 Pesticide sprays reduced to 3- 12 from 30 or 15000 tons
DISTRIBUTION OF THE BENEFITS • Smaller farmers adoption was about the same as larger farmers • Higher income groups adopted more completely than lower income groups • Smaller farms and farms which had lower income consistently obtained larger increases in net income than larger farmers and those with higher incomes • Farmers benefited by $ 45 to 69.6 million ( 82.5 to 87% ) • Seed companies benefited by gross revenue of $ 5-9.6 million • Monsanto and Delta Pine Land profitted by less than 6 percent of the income earned by farmers by adopting their Bt cotton
Performance of Bt MECH-162, non-Bt MECH-162, CC under IPM and CC without IPM Treatment IPM Non-IPM Bt MECH-162 non-Bt MECH-162 CC CC Area (ha) 5.76 1.44 18.70 7.28 Seed cotton 12.375a 9.620b 7.060c 3.704d Yield (q/ha)8* Yield of pigeonpea nil nil 2.47 1.47 (q/ha)** Returns (Rs/ha) 28462 22126 20420 11018 Cost of production, 12231 9693 9913 10074 including protecton (Rs/ha) New returns (Rs/ha) 16231 12433 10507 944 B:C ratio 2.327 2.283 2.060 1.094 Means with at least one letter common are not significantly different. *Market rate Rs.2300 per q seed cotton. ** Market rate Rs.1700 per q.
Population of sucking pests, bollworms and natural enemies Mean number of pests/natural enemies over the season IPM Non-IPM Insect pest Standard week# Bt MECH-162 Non- Bt MECH-162 CC CC Sucking pests* Whiteflies 30-42 0.15ª 0.15ª 0.24b 0.29b Jassids 30-42 0.07ª 0.07ª 0.14b 1.97c Thrips 30-42 4.88ª 4.56ª 5.98b 12.62c Aphids 30-42 3.96ª 3.50ª 20.56b 44.34c Bollworms** American bollworm eggs 31-49 0.12ª 0.12ª 0.08b 0.17c American bollworm larvae 31-49 0.03ª 0.06b 0.05b 0.09c Spotted bollworm larvae 31-49 0.00ª 0.01ª 0.03b 0.06c Natural enemies ** Green lacewign eggs 31-49 0.37ª 0.37ª 0.61b 0.26c Ladybird beetle adults 31-49 1.33ª 1.23ª 2.06b 0.69c Means with at least one letter common are not significantly different. # Standard week 30 corresponds to 23-29 July. 8 Number of insects/three leaves, ** Number of insects/plant.
WHY COMMUNICATE • People who have knowledge tend to accept. • People who lack knowledge reject. • Public determines commercial success. • Perception being based on misunderstood or distorted data. “That which is not understood is feared, and that which is feared is opposed”
The public should be viewed as a “partner” and a level of trust needs to be created. Developing this style will be a major challenge for business leaders as well as university scientists and government regulators. (NELKIN, 1997) PROPONENTS OF TECHNOLOGY SHOULD START COMMUNICATING EFFECTIVELY THAN OPPONENTS.