Download
1 / 68
680 likes | 816 Views
Phase 5.1 Modifications from Phase 5.0. Gary Shenk Modeling Subcommittee 9/9/2008. Upgrades in phase 5.1. Software: Complete revamp of BMP methods Improved low-flow nitrogen simulation Modification of regional factor calculation Improved river calibration rules Data:

E N D
Phase 5.1 Modificationsfrom Phase 5.0 Gary Shenk Modeling Subcommittee 9/9/2008
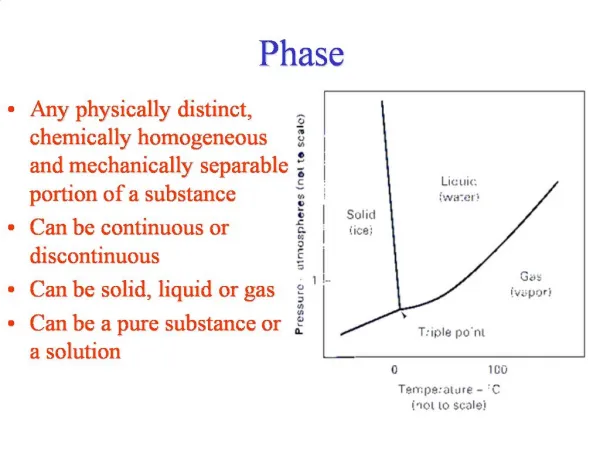
Upgrades in phase 5.1 • Software: • Complete revamp of BMP methods • Improved low-flow nitrogen simulation • Modification of regional factor calculation • Improved river calibration rules • Data: • January 1996 rain-on-snow event • Corrected some errors in the observed data set • New point sources • New atmospheric deposition
Upgrades in phase 5.1 • Software: • Complete revamp of BMP methods • Improved low-flow nitrogen simulation • Modification of regional factor calculation • Improved river calibration rules • Data: • January 1996 rain-on-snow event • Corrected some errors in the observed data set • New point sources • New atmospheric deposition
Old System BMP Data Factors by land-river segment, land use, and constituent Jeff S. Spreadsheets Phase 5.0 model
New System BMP Data NEIEN? Phase 5.1 model
New Functionality • New Abilities • Hydrologic BMP effects • Random BMP effects • Enhanced Functionality • Exclusive / non-exclusive BMPs • Easy to add new BMPs • Maximum implementation enforcement • Separate effectiveness by region
Hydrologic effect parameters HydTypes are different hydrologic effect models **Same type of specifications for random effects
Exclusive BMP Table Small grain early planting and small grain late planting are exclusive Forest Buffers and Grass Buffers are exclusive The two groups are not exclusive with respect to each other
Acreage by land-river segment The Constrained field refers to whether or not this particular LRseg is constrained to the maximum implementation percentage or can go to 100%
Specifications are scenario-specific • Test Influence of hydro rules • Different maximum implementation rates • Run uncertainty with BMP randomness
Upgrades in phase 5.1 • Software: • Complete revamp of BMP methods • Improved low-flow nitrogen simulation • Modification of regional factor calculation • Improved river calibration rules • Data: • January 1996 rain-on-snow event • Corrected some errors in the observed data set • New point sources • New atmospheric deposition
Improved Low-Flow Nitrogen • General under simulation of low-flows create dry soil conditions in the model • Increased soil moisture conditions • HSPF partitioning coefficient is based on mass • Switched to concentration
Partitioning Coefficients • Original formulation: • K = sorbed mass / mass in solution • With small amounts of water, concentrations can be very high • Revised formulation • K = sorbed mass / soil mass mass in solution / mass of water
Upgrades in phase 5.1 • Software: • Complete revamp of BMP methods • Improved low-flow nitrogen simulation • Modification of regional factor calculation • Improved river calibration rules • Data: • January 1996 rain-on-snow event • Corrected some errors in the observed data set • New point sources • New atmospheric deposition
Sediment in P5 (subgrid factors) Edge of Field BMP Factor Land Acre Factor Edge of Stream Subgrid Factor In Stream Concentrations
Nutrients in Phase 5 – Regional Factors Edge of Stream BMP Factor Regional Factor Land Acre Factor In Stream Concentrations
Calculation of Regional Factors • RF = (Lupstream*(1 – Bupstream/Bdownstream) + (Point+Atdep+Septic)*(1-Bdownstream) + EOS ) ( EOS * Bdownstream) • Highly dependent on estimates of the load bias, for which there is no observed comparison
Regional Factors – p5.0 Method • Regional factors previously determined at each calibration point with greater than 50 observations • Requires knowledge of load bias in the calibration which is uncertain • Uncertainly led to large changes in regional factors over a relatively small area
Regional Factors – p5.1 method • Use USGS Estimator as the ‘known’ load in the bias calculation. • Restrict regional factors to larger basins on which CBP decisions are made • Better load calculations at decision points • Worse calibration in small basins • Less ‘scattering’ of regional factors
CPL = CPD ML = PCR 1.25 0.7 0.5
Not a consistent story for TN either through Region or HGMR Weighted average is 1.02 so 1 is chosen consistently
Upgrades in phase 5.1 • Software: • Complete revamp of BMP methods • Improved low-flow nitrogen simulation • Modification of regional factor calculation • Improved river calibration rules • Better Reservoir simulation • Improved checks on parameter values • Data: • January 1996 rain-on-snow event • New point sources • New atmospheric deposition • Corrected some errors in the observed data set
Upgrades in phase 5.1 • Software: • Complete revamp of BMP methods • Improved low-flow nitrogen simulation • Modification of regional factor calculation • Improved river calibration rules • Data: • January 1996 rain-on-snow event • New point sources • New atmospheric deposition • Corrected some errors in the observed data set
January 7-13, 1996: The Blizzard of '96 or the Great Furlough Stormbegan early on Sunday, January 7. Just two days earlier, a six week impasse between a republican congress and a democratic president over the 1996 Federal Budget had finally come to an end. Many federal employees had been on furlough with government offices shut down. Employees would finally return to work on Monday, January 8. But mother nature had something else in mind. By Monday morning, Washington, DC was buried under 17 to 21 inches of snow. As much as 30 to 36 inches of snow fell over Frederick and Washington Counties. Baltimore recorded over 22 inches and even Ocean City received 10 inches of snow. A two-foot swath of heavy snow fell across Dorchester and Caroline Counties into southern Kent County, DE. The entire state was paralyzed and the Federal Government remained shut down. As road crews worked hard to clear the snow, an "Alberta Clipper" shot through on Tuesday, January 9 dumping an additional 3 to 5 inches from Washington northeast through Baltimore. Plows that would have been working on secondary roads and residential areas were sent back to the primary roads. The government remained shut for 4 days that week and many schools and businesses announced their closure for the entire week. A third storm struck on Friday, January 12 dumping another 4 to 6 inches over the metro areas. A maximum of 6 to 12 inches of snow fell over Frederick and Carroll Counties. By the week's end, most of Maryland, west of Baltimore, had seen 3 to 4 feet of snow! Most areas to the east had received 1 to 2 feet! Just one week later, a dramatic warming would occur melting the snow pack with an additional two to three inches of rain falling. • ”No one expected that such a deep snow pack could disappear in just one night.” • A flood was the result. It had been 60 years since a flood of this type had hit Maryland. The Potomac and Susquehanna saw major flooding. Ice Jams on the lower Susquehanna River compounded the flood. An ice jam broke sending a surge of ice and water down to the Conowingo Dam. It was more than the dam could handle and operators had no choice but to open all of their gates to prevent the dam from being topped. Once water tops a dam, the entire dam can fail. With the gates open, the water surged to the bay causing a rapid and significant flood to hit the town of Port Deposit just a few miles below the dam. People were able to flee the cold waters, but there was no time to save any belongings. http://www.erh.noaa.gov/lwx/Historic_Events/md-winter.html
No Modification Harrisburg