Download
1 / 16
190 likes | 455 Views
Food security…. ... exists when all people, at all times, have physical, social and economic access to sufficient, safe, and nutritious food to meet their dietary needs and food preferences for an active and healthy life. (UN-FAO 1996; 2012). … is more than food production

E N D
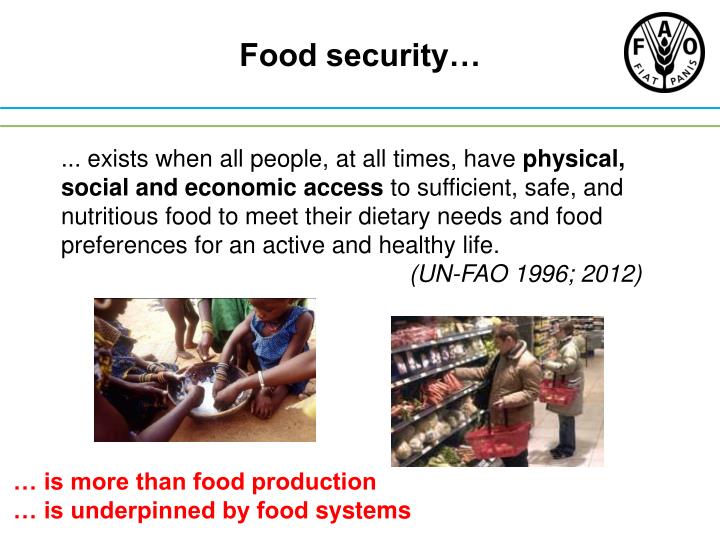
Food security… ... exists when all people, at all times, have physical, social and economic access to sufficient, safe, and nutritious food to meet their dietary needs and food preferences for an active and healthy life. (UN-FAO 1996; 2012) … is more than food production … is underpinned by food systems
The “Food System” Concept Food System ACTIVITIES Producing food: natural resources, inputs, markets, … Processing & packagingfood: raw materials, standards, storage requirement, … Distributing & retailingfood: transport, marketing, advertising, … Consumingfood: acquisition, preparation, customs, … Food System OUTCOMES Contributing to: • Social Welfare • Income • Employment • Wealth • Social capital • Political capital • Human capital • Environmental • Welfare • Ecosystem stocks & flows • Ecosystem services • Planetary Boundaries Food Security, i.e. stability over time for: FOOD UTILISATION FOOD ACCESS • Nutritional Value • Social Value • Food Safety • Affordability • Allocation • Preference FOOD AVAILABILITY • Production • Distribution • Exchange
So what are the contributions of Food Systems to crossing Planetary Boundaries? Food System ACTIVITIES Producing food Processing & Packaging food Distributing & Retailing food Consuming food ?
Agriculture as a source of GHG emissions Mt CO2-e, 2010 ~21%, including land-use change Worldwatch Institute’s Vital Signs Online Service (www.worldwatch.org)
Crossing planetary boundaries And the contribution of agriculture &fisheries Climate change Nitrogen cycle Rate of biodiversity loss
But ‘Food Systems’ involve more than ‘agriculture’ … Food System ACTIVITIES Producing food: natural resources, inputs, markets, … Processing & packagingfood: raw materials, standards, storage requirement, … Distributing & retailingfood: transport, marketing, advertising, … Consumingfood: acquisition, preparation, customs, …
… and a major proportion of GHG emissions from ‘OECD’ food systems are not from agriculture. UK USA India Producing Distributing Waste disposing Processing Consuming Garnett, FCRN, 2009 Pathak et al, Ag, Ecosys & Env, 2010 Edwards et al., InstAgric & Trade Policy,2009
UK’s food industry “costs”(post-farmgate) • 14% of energy consumption by UK businesses and 7 million tonnes of carbon emissions per year • 10% of all industrial use of the public water supply • 10% of the industrial and commercial waste stream • 25% of all HGV vehicle kilometres in the UK defra, 2006
Looking ahead …? (indicative; not to scale) 2050 The health and environmental consequences of satisfying this demand with current food systems would be dire 2025 kcal/person/day 2013 2200 - Too much - ----- Appropriate amount ----- -- Too little -- ------ Too much ------ ---- Appropriate amount ---- --- Too little --- 9 8 6 7 5 4 3 2 10 1 ----------- Too much ------------ --- Appropriate amount --- ----- Too little ----- Billions of people
Re-allocating human edible foodback to humans? 2.3 bn tons cereal produced in 2010/11 FAO Food Outlook 2013
Reducing food losses and waste? Source: FAO, Global Food Losses and Food Waste, 2011
Cereals: A plausible way ahead by 2025 50% more cereal cals/person/day, despite harvesting 15% less/person Edible cereal harvest After 15%lost on-farm After 34% fed to animals After 19% for biofuel After 15% lost in food chain 3150 3000 2675 • 2675 67% reduction in feeding to animals 15% reduction due to population increase and environmental change 2500 50% reduction in use for biofuels • 2400 33% reduction in on-farm losses 50% reduction in food chain losses • 2125 • 1900 2000 kcal/person/day • 1775 • 1725 1500 • 1250 850 1000 500 On-farm Animal feed Biofuel Food chain Nature of food ‘loss’ ‘Current’ data (in red) from FAO; & Luo, 2013
Cereals: A plausible way ahead by 2025 50% more cereal cals/person/day, despite harvesting 15% less/person Edible cereal harvest After 15%lost on-farm After 34% fed to animals After 19% for biofuel After 15% lost in food chain 3150 3000 2675 • 2675 67% reduction in feeding to animals 15% reduction due to population increase and environmental change 2500 50% reduction in use for biofuels • 2400 33% reduction in on-farm losses What are the obstacles? political, economic, social, technical 50% reduction in food chain losses • 2125 • 1900 2000 kcal/person/day • 1775 • 1725 1500 • 1250 850 1000 500 On-farm Animal feed Biofuel Food chain Nature of food ‘loss’ ‘Current’ data (in red) from FAO; & Luo, 2013
Optimum FS management needs to understand FS processes in context of drivers and feedbacks Environmental feedbacks e.g. water quality, GHGs GEC DRIVERS Changes in: Land cover & soils, Atmospheric Comp., Climate variability & means, Water availability & quality, Nutrient availability & cycling, Biodiversity, Sea currents & salinity, Sea level Food System ACTIVITIES Producing food Processing & Packaging food Distributing & Retailing food Consuming food ‘Natural’ DRIVERS e.g. Volcanoes Solar cycles DRIVERInteractions Food System OUTCOMES Contributing to: Food Security Social Welfare EnvironWelfare Socioeconomic DRIVERS Changes in: Demographics, Economics, Socio-political context, Cultural context Science & Technology Food Utilisation Food Access Food Availability Socioeconomic feedbacks e.g. livelihoods, social cohesion