Download
1 / 12
120 likes | 267 Views
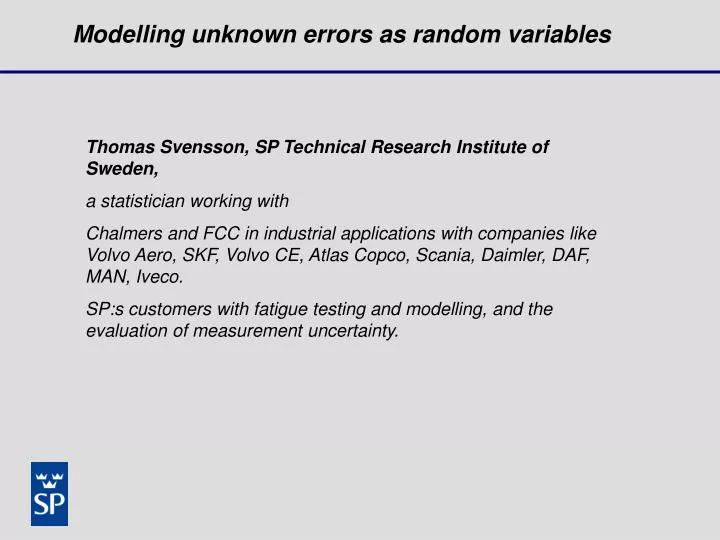
Modelling unknown errors as random variables. Thomas Svensson, SP Technical Research Institute of Sweden, a statistician working with Chalmers and FCC in industrial applications with companies like Volvo Aero, SKF, Volvo CE, Atlas Copco, Scania, Daimler, DAF, MAN, Iveco.

E N D
Modelling unknown errors as random variables Thomas Svensson, SP Technical Research Institute of Sweden, a statistician working with Chalmers and FCC in industrial applications with companies like Volvo Aero, SKF, Volvo CE, Atlas Copco, Scania, Daimler, DAF, MAN, Iveco. SP:s customers with fatigue testing and modelling, and the evaluation of measurement uncertainty.
Problems • Introduce statistics as an engineering tool for • measurement uncertainty • reliability with respect to fatigue failures Identify all sources of variation and uncertainty and put them in a statistical framework For both applications we use the Gauss approximation formula for the final uncertainty, where the covariances usually are neglected.
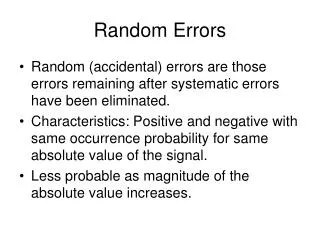
Sources of variation and uncertainty • We have random variables such as: • Electrical noise in instruments • A population of operators • Material strength scatter • Variability within geometrical tolerances • A population of users, drivers, missions, roads…
Sources of variation and uncertainty • We have also non-random variables which are sources of uncertainty: • Calibration error for instruments • Non-linearity in gage transfer functions • Sampling bias with respect to • suppliers • users • Statistical uncertainty in estimated parameters • Model errors: ….
sources of model errors Fatigue life assessment by calculations: corrections material properties material properties residual stresses Equivalent stress process, one or two dimensions. External force vector process Multiaxial stress process Cycle count Damage number transfer functions, static, dynamic reduction by principal stress, von Mises, Dang Van… rain flow count, level crossings, narrow band approximation, … Empirical relationships, Wöhler curve, Crack growth laws Model errors are introduced in all steps, reduction is necessary in order to compare with material strength, only simple empirical models are available because of the lack of detailed information, defects as microcracks, inclusions and pores are not at the drawing.
Modelling unknown errors as random variables A total measurement uncertainty depends on several sources, both random and non-random. Fatigue life prediction depends on several random variables, uncertain judgements and possible model errors. Can these different type of sources be put in a common statistical framework? How can we estimate the statistical properties of the sources?
Example 1, Calibration An instrument is constructed in such a way that the output is proportional to the value of the measurand. Calibration and linear regression gives the proportionality constant, the sensitivity b. The mathematical model: The statistical model: Statistical theory gives prediction intervals for future usage of the instrument based on n observations from the calibration
Example 1, Calibration A more true model: There is a systematic model error which violates the assumptions behind the prediction interval. Solution: hypothetical randomization. The measurement uncertainty by means of the prediction interval should be regarded as a measure of future usage where the level x is random. Restriction : Reduction of uncertainty by taking means of replicates will not be in control unless the variance for the random part is known. Regression procedure: If replicates are made on different levels, the regression should be made on mean values to get a proper estimate of the standard deviation. But, for the prediction interval this estimate must be adjusted since we actually estimate
Example 2, model error, plasticity In a specific numerical fatigue assessment at Volvo Aero they can, by experience, tell that the true plasticity correction is expected to be between the values given by “the linear rule” and “the Neuber rule”. We calculate the fatigue life assuming the “linear rule”, keeping all other variables and procedures at their nominal values. The fatigue life prediction is: We calculate the fatigue life assuming the “Neuber rule”, keeping all other variables and procedures at their nominal values. The fatigue life prediction is: We now regard the unknown systematic error as a uniform random variable with variance:
Example 2, model error, plasticity How can this procedure be justified? What are the implications? Hypothetical randomisation by regarding the air engine chief engineers as a population? Hardly! In fact, the choice will introduce a systematic error for all VAC engines and the statistical measure will not comply with observed failure rates.
Example 3, Instrument bias A testing laboratory buys an instrument that is specified to have the accuracy, say 0.2%. What does this mean? Usually it means that the systematic error is less than 0.2% of the maximum output. How can this systematic error be handled in a statistical sense? For global comparisons one can regard it as a random bias, which hopefully has mean zero. It can then be included as a random contribution for global uncertainty statements. In a single laboratory there may be several similar instruments and by assuming that the operator always makes a random choice, also the local bias may be regarded as random and be included in the laboratory uncertainty. For comparisons the systematic error can be eliminated by using the same instrument and be excluded from uncertainty statements for comparative measurements.
Discussion In some engineering problems often uncertainties are far more important than random variation. This has resulted in the rejection of statistical tools and “worst case” estimates, “conservative” modelling and vague safety factors are kept in use. By putting also uncertainties in the statistical framework it is possible to take advantage of the statistical tools, compare all sources of scatter and uncertainty, and be more rational in updating and refinement of models. • Reduction of variance by mean values of replicates is out of control. • The resulting uncertainty measure in reliability cannot be interpreted as a failure rate. • Large systematic errors should be eliminated by classification, better modelling, or more experiments. • Are there more problems?