Download
1 / 53
530 likes | 650 Views
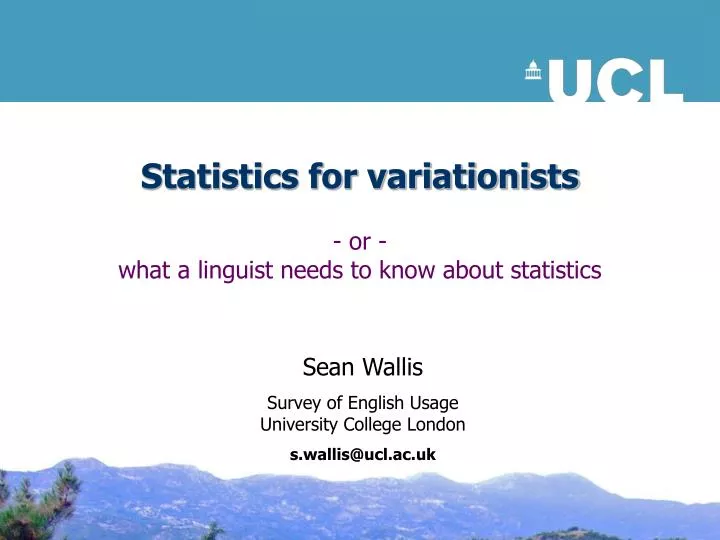
Statistics for variationists. - or - what a linguist needs to know about statistics . Sean Wallis Survey of English Usage University College London s.wallis@ucl.ac.uk. Outline. What is the point of statistics? Variationist corpus linguistics How inferential statistics works

E N D
Statistics for variationists - or -what a linguist needs to know about statistics Sean Wallis Survey of English Usage University College London s.wallis@ucl.ac.uk
Outline • What is the point of statistics? • Variationist corpus linguistics • How inferential statistics works • Introducing ztests • Two types (single-sample and two-sample) • How these tests are related to χ² • ‘Effect size’ and comparing results of experiments • Methodological implications for corpus linguistics
What is the point of statistics? • Analyse data you already have • corpus linguistics • Design new experiments • collect new data, add annotation • experimental linguistics ‘in the lab’ • Try new methods • pose the right question • We are going to focus onz and χ² tests
What is the point of statistics? } • Analyse data you already have • corpus linguistics • Design new experiments • collect new data, add annotation • experimental linguistics ‘in the lab’ • Try new methods • pose the right question • We are going to focus onz and χ² tests observational science } experimental science } philosophy of science } a little maths
What is ‘inferentialstatistics’? • Suppose we carry out an experiment • We toss a coin 10 times and get 5 heads • How confident are we in the results? • Suppose we repeat the experiment • Will we get the same result again? • Inferential statistics is a method of inferringthe behaviour of future ‘ghost’ experiments from one experiment • We infer from the sample to the population • Let us consider one type of experiment • Linguistic alternation experiments
Alternation experiments • A variationist corpus paradigm • Imagine a speaker forming a sentence as a series of decisions/choices. They can • add: choose to extend a phrase or clause, or stop • select: choose between constructions • Choices will be constrained • grammatically • semantically
Alternation experiments • A variationist corpus paradigm • Imagine a speaker forming a sentence as a series of decisions/choices. They can • add: choose to extend a phrase or clause, or stop • select: choose between constructions • Choices will be constrained • grammatically • semantically • Research question: • within these constraints,what factors influence the particular choice?
Alternation experiments • Laboratory experiment (cued) • pose the choice to subjects • observe the one they make • manipulate different potential influences • Observational experiment (uncued) • observe the choices speakers make when they make them (e.g. in a corpus) • extract data for different potential influences • sociolinguistic: subdivide data by genre, etc • lexical/grammatical: subdivide data by elements in surrounding context • BUT the alternate choice is counterfactual
Statistical assumptions • A random sample taken from the population • Not always easy to achieve • multiple cases from the same text and speakers, etc • may be limited historical data available • Be careful with data concentrated in a few texts • The sample is tiny compared to the population • This is easy to satisfy in linguistics! • Observations are free to vary (alternate) • Repeated sampling tends to form a Binomial distribution around the expected mean • This requires slightly more explanation...
1 3 5 7 9 The Binomial distribution • Repeated sampling tends to form a Binomial distribution around the expected mean P F • We toss a coin 10 times, and get 5 heads N = 1 P x
1 3 5 7 9 The Binomial distribution • Repeated sampling tends to form a Binomial distribution around the expected mean P F • Due to chance, some samples will have a higher or lower score N = 4 P x
1 3 5 7 9 The Binomial distribution • Repeated sampling tends to form a Binomial distribution around the expected mean P F • Due to chance, some samples will have a higher or lower score N = 8 P x
1 3 5 7 9 The Binomial distribution • Repeated sampling tends to form a Binomial distribution around the expected mean P F • Due to chance, some samples will have a higher or lower score N = 12 P x
1 3 5 7 9 The Binomial distribution • Repeated sampling tends to form a Binomial distribution around the expected mean P F • Due to chance, some samples will have a higher or lower score N = 16 P x
1 3 5 7 9 The Binomial distribution • Repeated sampling tends to form a Binomial distribution around the expected mean P F • Due to chance, some samples will have a higher or lower score N = 20 P x
1 3 5 7 9 The Binomial distribution • Repeated sampling tends to form a Binomial distribution around the expected mean P F • Due to chance, some samples will have a higher or lower score N = 24 P x
1 3 5 7 9 Binomial Normal • The Binomial (discrete) distribution is close to the Normal (continuous) distribution F x
The central limit theorem • Any Normal distribution can be defined by only two variables and the Normal function z population mean P standard deviations = P(1 – P) / n F • With more data in the experiment, s will be smaller z . s z . s • Divide x by 10 for probability scale 0.1 0.3 0.5 0.7 p
The central limit theorem • Any Normal distribution can be defined by only two variables and the Normal function z population mean P standard deviations = P(1 – P) / n F z . s z . s • 95% of the curve is within ~2 standard deviations of the expected mean • the correct figure is 1.95996! • the critical value of z for an error level of 0.05. 2.5% 2.5% 95% 0.1 0.3 0.5 0.7 p
The central limit theorem • Any Normal distribution can be defined by only two variables and the Normal function z population mean P standard deviations = P(1 – P) / n F z . s z . s za/2 • the critical value of z for an error level a of 0.05. 2.5% 2.5% 95% 0.1 0.3 0.5 0.7 p
The single-sample ztest... • Is an observationp > z standard deviations from the expected (population) mean P? • If yes, p is significantly different from P F observation p z . s z . s 0.25% 0.25% P 0.1 0.3 0.5 0.7 p
...gives us a “confidence interval” • P±z . s is the confidence interval for P • We want to plot the interval about p F z . s z . s 0.25% 0.25% P 0.1 0.3 0.5 0.7 p
...gives us a “confidence interval” • P±z . s is the confidence interval for P • We want to plot the interval about p observation p F w– w+ P 0.25% 0.25% 0.1 0.3 0.5 0.7 p
...gives us a “confidence interval” • The interval about pis called the Wilson score interval observation p • This interval is asymmetric • It reflects the Normal interval about P: • If P is at the upper limit of p,p is at the lower limit of P F w– w+ P 0.25% 0.25% (Wallis, to appear, a) 0.1 0.3 0.5 0.7 p
...gives us a “confidence interval” • The interval about pis called theWilson score interval observation p • To calculate w–andw+ we use this formula: F w– w+ P 0.25% 0.25% (Wilson, 1927) 0.1 0.3 0.5 0.7 p
1.0 p(shall | {shall, will}) 0.8 0.6 0.4 0.2 0.0 1955 1960 1965 1970 1975 1980 1985 1990 1995 Plotting confidence intervals • Plotting modal shall/will over time (DCPSE) • Small amounts of data / year • Highly skewed p in some cases • p = 0 or 1 (circled) • Confidence intervals identify the degree of certainty in our results (Wallis, to appear, a)
0.25 p 0.20 0.15 0.10 0.05 x 0.00 0 1 2 3 4 Plotting confidence intervals • Probability of adding successive attributive adjective phrases (AJPs) to a NP in ICE-GB • x = number of AJPs • NPs get longer adding AJPs is more difficult • The first two falls are significant, the last is not
2 x 1 goodness of fit χ² test • Same as single-sample z test for P (z² = χ²) • Does the value of a affect p(b)? F p(b | a) z . s z . s p(b) P = p(b) p(b | a) IV:A = {a, ¬a} DV:B = {b, ¬b} p
2 x 1 goodness of fit χ² test • Same as single-sample z test for P (z² = χ²) • Or Wilson test for p (by inversion) F p(b) P = p(b) w– w+ p(b | a) IV:A = {a, ¬a} DV:B = {b, ¬b} p(b | a) p
The single-sample ztest • Compares an observation with a given value • Compare p(b| a) with p(b) • A “goodness of fit” test • Identical to a standard 21 χ² test • Note that p(b) is given • All of the variation is assumedto be in the estimate of p(b| a) • Could also comparep(b | ¬a)with p(b) p(b) p(b | a) p(b | ¬a)
ztest for 2 independent proportions • Method: combine observed values • take the difference (subtract) |p1–p2| • calculate an ‘averaged’ confidence interval p2 = p(b| ¬a) F O1 O2 p1 = p(b| a) (Wallis, to appear, b) p
ztest for 2 independent proportions • New confidence interval D = |O1 – O2| • standard deviations'= p(1 – p) (1/n1 +1/n2) • p = p(b) • comparez.s' withx = |p1–p2| ^ ^ ^ x D z.s' (Wallis, to appear, b) 0 meanx = 0 p
ztest for 2 independent proportions • Identical to a standard 22 χ² test • So you can use the usual method!
ztest for 2 independent proportions • Identical to a standard 22 χ² test • So you can use the usual method! • BUT: 21 and 22 tests have different purposes • 21 goodness of fit compares single value a with supersetA • assumes onlya varies • 22 test compares two valuesa, ¬awithin a set A • both values may vary A g.o.f. c2 ¬a a 2 2 c2 IV:A = {a, ¬a}
ztest for 2 independent proportions • Identical to a standard 22 χ² test • So you can use the usual method! • BUT: 21 and 22 tests have different purposes • 21 goodness of fit compares single value a with supersetA • assumes onlya varies • 22 test compares two valuesa, ¬awithin a set A • both values may vary • Q: Do we need χ²? A g.o.f. c2 ¬a a 2 2 c2 IV:A = {a, ¬a}
Larger χ² tests • χ² is popular because it can be applied to contingency tables with many values • r 1 goodness of fit χ² tests (r 2) • r c χ² tests for homogeneity (r,c 2) • ztests have 1 degree of freedom • strength: significance is due to only one source • strength: easy to plot values and confidence intervals • weakness: multiple values may be unavoidable • With larger χ² tests, evaluate and simplify: • Examine χ² contributions for each row or column • Focus on alternation - try to test for a speaker choice
How big is the effect? • These tests do not measure the strength of the interaction between two variables • They test whether the strength of an interaction is greater than would be expected by chance • With lots of data, a tiny change would be significant • Don’t use χ², p or z values to compare two different experiments • A result significant at p<0.01 is not ‘better’ than one significant at p<0.05 • There are a number of ways of measuring ‘association strength’ or ‘effect size’
How big is the effect? • Percentage swing • swingd = p(a | ¬b) – p(a| b) • % swing d%= d/p(a| b) • frequently used (“X increased by 50%”) • may have confidence intervals on change • can be misleading (“+50%” then “-50%” is not zero) • one change, not sequence • over one value, not multiple values
How big is the effect? • Percentage swing • swingd = p(a | ¬b) – p(a| b) • % swing d%= d/p(a| b) • frequently used (“X increased by 50%”) • may have confidence intervals on change • can be misleading (“+50%” then “-50%” is not zero) • one change, not sequence • over one value, not multiple values • Cramér’s φ • = χ²/N(22) N= grand total • c = χ²/(k – 1)N(rc) k= min(r, c) • measures degree of association of one variable with another (across all values)
Comparing experimental results • Suppose we have two similar experiments • How do we test if one result is significantly stronger than another?
Comparing experimental results • Suppose we have two similar experiments • How do we test if one result is significantly stronger than another? • Test swings • ztest for two samples from different populations • Uses' = s12 + s22 • Test |d1(a) – d2(a)| > z.s' 0 -0.1 -0.2 -0.3 -0.4 -0.5 -0.6 d1(a) d2(a) -0.7 (Wallis 2011)
Comparing experimental results • Suppose we have two similar experiments • How do we test if one result is significantly stronger than another? • Test swings • ztest for two samples from different populations • Uses' = s12 + s22 • Test |d1(a) – d2(a)| > z.s' • Same method can be used to compare other z or χ² tests 0 -0.1 -0.2 -0.3 -0.4 -0.5 -0.6 d1(a) d2(a) -0.7 (Wallis 2011)
Modern improvements on zand χ² • ‘Continuity correction’ for small n • Yates’ χ2 test • errs on side of caution • can also be applied to Wilson interval • Newcombe (1998) improves on 22 χ² test • combines two Wilson score intervals • performs better than χ² and log-likelihood (etc.) for low-frequency events or small samples • However, for corpus linguists, there remains one outstanding problem...
Experimental design • Each observation should be free to vary • i.e. p can be any value from 0 to 1 p(b | words) p(b | VPs) p(b | tensed VPs) b1 b2
Experimental design • Each observation should be free to vary • i.e. p can be any value from 0 to 1 • However many people use these methods incorrectly • e.g. citation ‘per million words’ • what does this actually mean? p(b | words) p(b | VPs) p(b | tensed VPs) b1 b2
Experimental design • Each observation should be free to vary • i.e. p can be any value from 0 to 1 • However many people use these methods incorrectly • e.g. citation ‘per million words’ • what does this actually mean? • Baseline should be choice • Experimentalists can designchoice into experiment • Corpus linguists have to infer when speakers had opportunity to choose, counterfactually p(b | words) p(b | VPs) p(b | tensed VPs) b1 b2
A methodological progression • Aim: • investigate change when speakers have a choice • Four levels of experimental refinement: pmw words
A methodological progression • Aim: • investigate change when speakers have a choice • Four levels of experimental refinement: select a plausible baseline pmw words tensed VPs
A methodological progression • Aim: • investigate change when speakers have a choice • Four levels of experimental refinement: select a plausible baseline grammatically restrict data or enumerate cases pmw {will,shall} words tensed VPs
A methodological progression • Aim: • investigate change when speakers have a choice • Four levels of experimental refinement: select a plausible baseline check each case individually for plausibility of alternation grammatically restrict data or enumerate cases pmw {will,shall} {will,shall} words tensed VPs Ye shall be saved