Download
1 / 2
20 likes | 175 Views
W-band reentrant cavity measurement. L. Song, N. Luhmann, Jr University of California, Davis G. Scheitrum, G. Caryotakis Stanford Linear Accelerator Center. Abstract:

E N D
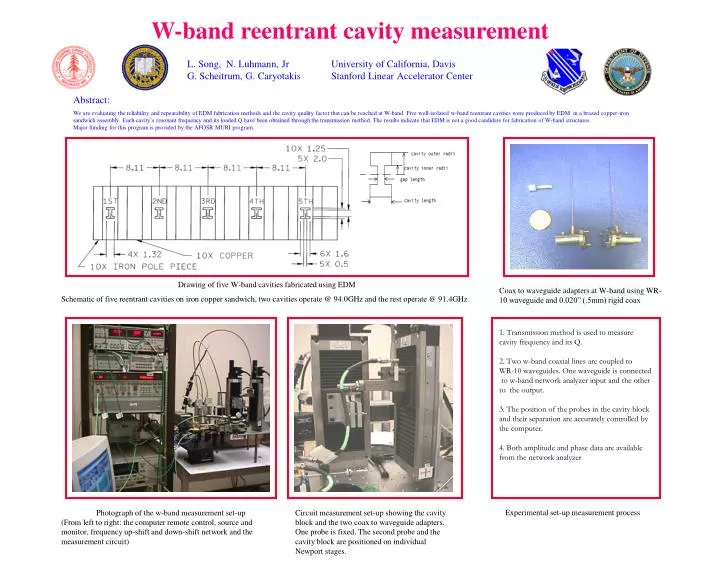
W-band reentrant cavity measurement L. Song, N. Luhmann, Jr University of California, Davis G. Scheitrum, G. Caryotakis Stanford Linear Accelerator Center Abstract: We are evaluating the reliability and repeatability of EDM fabrication methods and the cavity quality factor that can be reached at W-band. Five well-isolated w-band reentrant cavities were produced by EDM in a brazed copper-iron sandwich assembly. Each cavity’s resonant frequency and its loaded Q have been obtained through the transmission method. The results indicate that EDM is not a good candidate for fabrication of W-band structures. Major funding for this program is provided by the AFOSR MURI program. Drawing of five W-band cavities fabricated using EDM Schematic of five reentrant cavities on iron copper sandwich, two cavities operate @ 94.0GHz and the rest operate @ 91.4GHz Coax to waveguide adapters at W-band using WR-10 waveguide and 0.020” (.5mm) rigid coax 1. Transmission method is used to measure cavity frequency and its Q. 2. Two w-band coaxial lines are coupled to WR-10 waveguides. One waveguide is connected to w-band network analyzer input and the other to the output. 3. The position of the probes in the cavity block and their separation are accurately controlled by the computer. 4. Both amplitude and phase data are available from the network analyzer Photograph of the w-band measurement set-up (From left to right: the computer remote control, source and monitor, frequency up-shift and down-shift network and the measurement circuit) Circuit measurement set-up showing the cavity block and the two coax to waveguide adapters. One probe is fixed. The second probe and the cavity block are positioned on individual Newport stages. Experimental set-up measurement process
S21 phase of 4th 91.465GHz cavity Illustration of measurement of 4th cavity Broad-band measurement of S21 for the 4th cavity frequency sweep=25MHz Narrow-band S21 measurement for the 4th cavity frequency sweep=1.0MHz S21 phase of 4th 91.465GHz cavity Summary Measurement Results 1. Five EDM fabricated w-band reentrant cavities have been measured through transmission method. 2. The cavity resonant frequencies agree with the theoretical design within the fabrication accuracy. 3. Fairly low cavity Qs have been obtained. EDM does not produce a good high-Q surface. Future Work 1. Repeat Q measurements for LIGA fabricated cavities. 2. Improve the match of the coax to waveguide adaptors. 3. Detuned short measurement may provide a more accurate unloaded Q. Cavity fabrication dimensional errors Desired and measured frequencies for each cavity Acknowledgement Thanks to E. Colby and M. Hill for their help with the network analyzer and the experiment set-up and F. Glendining, W.R Fowkes and D. Sprehn for their discussion of cold test methods. List of measured resonant frequencies and loaded Qs