Download
1 / 33
330 likes | 478 Views
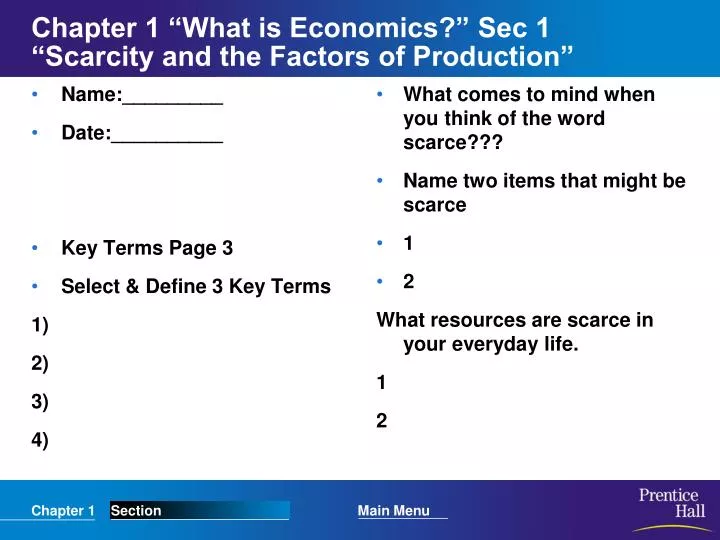
Name:_________ Date:__________ Key Terms Page 3 Select & Define 3 Key Terms 1) 2) 3) 4). What comes to mind when you think of the word scarce??? Name two items that might be scarce 1 2 What resources are scarce in your everyday life. 1 2.

E N D
Name:_________ Date:__________ Key Terms Page 3 Select & Define 3 Key Terms 1) 2) 3) 4) What comes to mind when you think of the word scarce??? Name two items that might be scarce 1 2 What resources are scarce in your everyday life. 1 2 Chapter 1 “What is Economics?” Sec 1 “Scarcity and the Factors of Production”
Warm up • The country is in an economic crisis in what way(s) has this economic crisis effected you and your family? 1) 2) 3)
Scarcity and the Factors of Production • What is economics? • How do economists define scarcity? • What are the three factors of production?
What Is Economics? • Economics is the study of how people make choices to satisfy their wants • For example: • You must choose how to spend your time • Businesses must choose how many people to hire • What are some examples that relate to the current economic crisis?
Scarcity occurs when there are limited quantities of resources to meet unlimited needs or desires Scarcity • Something is considered scarce when its availability is not enough to meet demand. Examples • Water • Time during finals • ??????
Shortages occur when producers will not or cannot offer goods or services at current prices Shortages • It is related to price! If the price is too low there will be a shortage. Why? • Difference between the demand for a product or service and the amount supplied in a market. • Examples • 1973 Oil Crisis • ??????
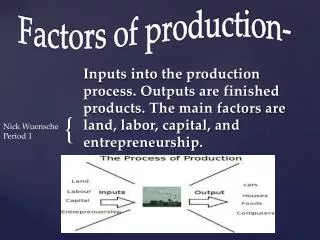
The Factors of Production • Land All natural resources that are used to produce goods and services. STUFF FOUND IN NATURE! • Labor Any effort a person devotes to a task for which that person is paid. • Capital Any human-made resource that is used to create other goods and services. • Physical Capital: Special Machines, Buildings • Human Capital: “Brain stuff” Knowledge/Experience
Land Foam Blank Fiberglass Labor The human effort to design and shape the board The human effort to fiberglass the surf board Capital Sander to shape the foam core Tools to apply the fiberglass The Factors of a Surf Board Manufacturer
Section 1 Assessment 1. What is the difference between a shortage and scarcity? (a) A shortage can be temporary or long-term, but scarcity always exists. (b) A shortage results from rising prices; a scarcity results from falling prices. (c) A shortage is a lack of all goods and services; a scarcity concerns a single item. (d) There is no real difference between a shortage and a scarcity. 2. Which of the following is an example of using physical capital to save time and money? (a) hiring more workers to do a job (b) building extra space in a factory to simplify production (c) switching from oil to coal to make production cheaper (d) lowering workers’ wages to increase profits Want to connect to the PHSchool.com link for this section? Click Here!
Section 1 Assessment 1. What is the difference between a shortage and scarcity? (a) A shortage can be temporary or long-term, but scarcity always exists. (b) A shortage results from rising prices; a scarcity results from falling prices. (c) A shortage is a lack of all goods and services; a scarcity concerns a single item. (d) There is no real difference between a shortage and a scarcity. 2. Which of the following is an example of using physical capital to save time and money? (a) hiring more workers to do a job (b) building extra space in a factory to simplify production (c) switching from oil to coal to make production cheaper (d) lowering workers’ wages to increase profits Want to connect to the PHSchool.com link for this section? Click Here!
Homework Questions • Page 6 • 1 • 2 • 3 • 4 • 5 • 6 • 7 • 8 • 9 • 10
Section 1 Assessment Page 6 • Key Terms and Main Ideas # 1 # 6 • Applying Economic Concepts # 8 # 9
Chapter 1 section 2: Opportunity Cost • Name:________ • Date:_________ Select & Define 4 Key Terms Page 8 • 1) • 2) • 3) • 4)
Warm up • List 5 appealing vacation destinations: • 1) • 2) • 3) • 4) • 5) • Circle your favorite one • Why was that your first choice?
Opportunity Cost • Does every decision you make involve trade-offs? • How can a decision-making grid help you identify the opportunity cost of a decision? • How will thinking at the margin affect decisions you make?
Trade-offs and Opportunity Cost • Trade-offs are all the alternatives that we give up whenever we choose one course of action over others. • The most desirable alternative given up as a result of a decision is known as opportunity cost. • What are some of the trade-offs for the economic bail out package? All individuals and groups of people make decisions that involve trade-offs.
Karen’s Decision-making Grid Alternatives Sleep late Wake up early to study Benefits • Enjoy more sleep • Have more energy during the day • Better grade on test • Teacher and parental approval • Personal satisfaction Decision • Sleep late • Wake up early to study for test Opportunity cost • Extra study time • Extra sleep time Benefits forgone • Better grade on test • Teacher and parental approval • Personal satisfaction • Enjoy more sleep • Have more energy during the day The Decision-Making Grid • Economists encourage us to consider the benefits and costs of our decisions.
Create Your Own Decision Making Grid • ____________ Decision Making Grid • Benefits _____________ _______________
Options 1st hour of extra study time 2nd hour of extra study time 3rd hour of extra study time Benefit Grade of C on test Grade of B on test Grade of B+ on test Opportunity Cost 1 hour of sleep 2 hours ofsleep 3 hours of sleep Thinking at the Margin • When you decide how much more or less to do, you are thinking at the margin.
Section 2 Assessment 1. Opportunity cost is (a) any alternative we sacrifice when we make a decision. (b) all of the alternatives we sacrifice when we make a decision. (c) the most desirable alternative given up as a result of a decision. (d) the least desirable alternative given up as a result of a decision. 2. Economists use the phrase “guns or butter” to describe the fact that (a) a person can spend extra money either on sports equipment or food. (b) a person must decide whether to manufacture guns or butter. (c) a nation must decide whether to produce more or less military or consumer goods. (d) a government can buy unlimited military and civilian goods if it is rich enough. Want to connect to the PHSchool.com link for this section? Click Here!
Section 2 Assessment 1. Opportunity cost is (a) any alternative we sacrifice when we make a decision. (b) all of the alternatives we sacrifice when we make a decision. (c) the most desirable alternative given up as a result of a decision. (d) the least desirable alternative given up as a result of a decision. 2. Economists use the phrase “guns or butter” to describe the fact that (a) a person can spend extra money either on sports equipment or food. (b) a person must decide whether to manufacture guns or butter. (c) a nation must decide whether to produce more or less military or consumer goods. (d) a government can buy unlimited military and civilian goods if it is rich enough. Want to connect to the PHSchool.com link for this section? Click Here!
Section 2 Assessment Page 11 • Key Terms and Main Ideas: • # 2 • # 3 • # 4 • Applying Economic Concepts: • #5 • #6 • #9
Ch 1 Section 3 Production Possibilities Curves • Name: _______ • Date: _________ • Select 4 Key Terms (page 13) 1) 2) 3) 4)
Warm up • Why do graphs show information more clearly than text? (Please answer in 2-3 sentences) • Read Skills for Life (page 12) answer questions!!!
Production Possibilities Graphs • What is a production possibilities graph? • How do production possibilities graphs show efficiency, growth, and cost? • Why are production possibilities frontiers curved lines?
Production Possibilities Graph 25 20 15 10 5 Watermelons (millions of tons) Shoes(millions of pairs) 0 15 a (0,15) 8 14 b (8,14) 14 18 20 21 12 9 5 0 Shoes (millions of pairs) c (14,12) d (18,9) e (20,5) A production possibilities frontier f (21,0) 0 5 10 15 20 25 Watermelons (millions of tons) Production Possibilities • A production possibilities graph shows alternative ways that an economy can use its resources. • The production possibilities frontier is the line that shows the maximum possible output for that economy.
Production Possibilities Graph 25 20 15 10 5 S Shoes (millions of pairs) a (0,15) b (8,14) c (14,12) g (5,8) d (18,9) A point of underutilization e (20,5) f (21,0) 0 5 10 15 20 25 Watermelons (millions of tons) Efficiency • Efficiency means using resources in such a way as to maximize the production of goods and services. An economy producing output levels on the production possibilities frontier is operating efficiently.
Production Possibilities Graph 25 20 15 10 5 Future production Possibilities frontier T S a (0,15) Shoes (millions of pairs) b (8,14) c (14,12) d (18,9) e (20,5) f (21,0) 0 5 10 15 20 25 Watermelons (millions of tons) Growth • Growth If more resources become available, or if technology improves, an economy can increase its level of output and grow. When this happens, the entire production possibilities curve “shifts to the right.”
Production Possibilities Graph 25 20 15 10 5 Watermelons (millions of tons) Shoes(millions of pairs) 0 15 8 14 c (14,12) 14 18 20 21 12 9 5 0 Shoes (millions of pairs) d (18,9) 0 5 10 15 20 25 Watermelons (millions of tons) Cost • Cost A production possibilities graph shows the cost of producing more of one item. To move from point c to point d on this graph has a cost of 3 million pairs of shoes.
Section 3 Assessment 1. A production possibilities frontier shows (a) farm goods and factory goods produced by an economy. (b) the maximum possible output of an economy. (c) the minimum possible output of an economy. (d) underutilization of resources. 2. An economy that is using its resources to produce the maximum number of goods and services is described as (a) efficient. (b) underutilized. (c) growing. (d) trading off. Want to connect to the PHSchool.com link for this section? Click Here!
Section 3 Assessment 1. A production possibilities frontier shows (a) farm goods and factory goods produced by an economy. (b) the maximum possible output of an economy. (c) the minimum possible output of an economy. (d) underutilization of resources. 2. An economy that is using its resources to produce the maximum number of goods and services is described as (a) efficient. (b) underutilized. (c) growing. (d) trading off. Want to connect to the PHSchool.com link for this section? Click Here!
Key Terms and Main Ideas # 1. # 2. # 3. Applying Economic Concepts # 5. # 6. Section 3 Assessment (page 18)
Sec. 3 Guided Reading and Review Production Possibilities Curves • 1. Horizontal and vertical axes • 2. points plotted on the graph • 3. line connecting the plotted points • 4. production possibilities frontier • 5. points inside the production possibilities frontier • 6. line outside the production possibilities frontier • 7. graph shows the alternative ways to use an economy’s resources • 8. line on a production possibilities curve that shows the maximum possible output • 9. using resources in such a way as to maximize the output of goods and services • 10. using fewer resources than an economy is capable of using • 11. alternative that is given up because of a decision • 12.Shifting factors of production from making one good or service to another increases the cost of producing the second item.