Download
1 / 27
290 likes | 482 Views
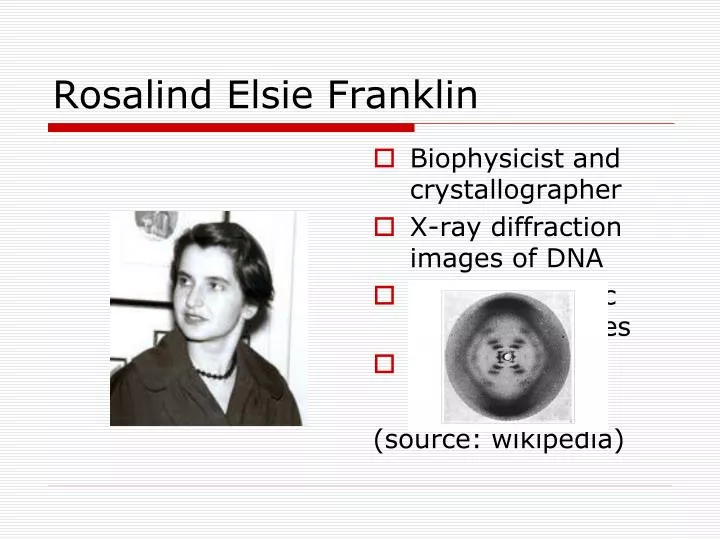
Rosalind Elsie Franklin. Biophysicist and crystallographer X-ray diffraction images of DNA Tobacco mosaic and polio viruses 1920-1958 (source: wikipedia). A Structural Split in the Human Genome. Clara S. M. Tang and Richard J. Epstein PLoS One (2007) 7:e603 February 13, 2007

E N D
Rosalind Elsie Franklin • Biophysicist and crystallographer • X-ray diffraction images of DNA • Tobacco mosaic and polio viruses • 1920-1958 (source: wikipedia)
A Structural Split in the Human Genome Clara S. M. Tang and Richard J. Epstein PLoS One (2007) 7:e603 February 13, 2007 I. Elizabeth Cha
Introduction • PCIs Promoter-associated CpG islands • Mediate methylation-dependent gene silencing • Co-locate to transcriptionally active genes • 60% of human genes contains PCIs
CpG Islands • Genomic regions containing high frequency of CG dinucleotides • CpG cytidine-phosphodiester-guanosine • Formal definition • At least 200bp • GC percentage >50% • CpG ratio >60%
Materials and Methods • Sequence data and annotations • Determination of CpG island overlapping transcription start site • Housekeeping genes and paralogs of pseudogenes • Bimodal distribution of GC content • Gene expression data • Evolutionary rate determination • Principal component analysis
Sequence Data and Annotations • UCSC genomic assemblies, RefSeq dataset, Emsembl gene dataset • Human (hg18, 3/2006) • Mouse (mm6, 3/2006) • Fugu (fr1, 8/2002) • Fruit fly (dm2, 4/2004) • Worm (ce2, 3/2004)
Data Preprocessing • RepeatMask – Alu • Discard sequences • Not commencing with ATG codons • Not terminating with canonical stop codons • Retain the longest genomic sequences containing identical exonic sequences
Determination of CpG Island Overlapping Transcription Start Site • Download CpG islands annotation (cpgIslandExt) from UCSC • Identify CpG islands overlapping with promoter regions • Map with RefGene annotation (200bp upstream and 500bp downstream)
Data and Tools • 502 Housekeeping genes • 1220 pseudogene paralogs • NOCOM program • SAGEmap • Homologue data • XSTAT
Results – PCI+ Genes • Housekeeping gene higher GC content lower intron length/number • Pseudogene paralog lower GC content higher intron length/number • Functional distinguishable
Results – PCI- Genes • Higher evolutionary rate • Narrower expression breadth than PCI+ genes • More frequent tissue-specific inactivation
Figure 1 Biphasic GC/AT Distribution of PCI+ Genes A. Distribution of GC content among different regions of genes intronic coding region 5’ UTR 3’ UTR
Figure 1 Biphasic GC/AT Distribution of PCI+ Genes (cont’d) B&C Proportion of genes among different GC groups.
Figure 2 GC Content of Promoter vs. Non-promoter CpG Island Overlapping Genes Genes with medium total intron size (10-50kb) All genes Genes with short total intron size (<10kb) and long intron size (>50kb) Intronless genes PCI+: solid line; PCI-: dash line
Figure 3 Distribution of Coding GC% of RefGenes with PCIs House-keeping genes pseudogenes
Figure 4 Quantitative Comparison of Gene Subsets L: low, GC<40%; H: high, GC>65%; double dark, <0.001; single dark, <0.01; open, < 0.05
Figure 4 Quantitative Comparison of Gene Subsets (cont’d) L: low, GC<40%; H: high, GC>65%; double dark, <0.001; single dark, <0.01; open, < 0.05
Figure 4 Quantitative Comparison of Gene Subsets (cont’d) L: low, GC<40%; H: high, GC>65%; double dark, <0.001; single dark, <0.01; open, < 0.05
Conclusions • PCIs • Transcriptional regulators • Evolutionary accelerators to facilitate intron insertion • Mthylated PCIs on transcription and chromatin accelerate adaptive evolution towards biological complexity
Conclusions • Adaptive evolution of human genome • Declining transcription of a subset of PCI+ genes • Predisposing to both CpGTpA mutation and intron insertion • Biological complexity model • Environmentally selected gains/losses of PCI methylation (+/-) • Polarizing PCI+ gene structures arounda genomic core of ancestral PCI- genes
Discussion • AT-rich, PCI+ gene vs. GC-rich PCI+ housekeeping gene • Lower transcriptional activity • Higher intron number • Higher evolutionary rate • Loss of negative selection pressure
Discussion (cont’d) • PCI- genes vs. PCI+ genes • Higher evolutionary rate • Lower expression breadth • Intron number relates more directly to PCI positivity
Figure 5 Principal component analysis (PCA) A. PCA analysis using six variables at either 53% (left) or 59% (right) variance
Figure 5 Principal component analysis (PCA) (cont’d) B. 2D dot plots C. 3D dot plots GC-rich, blue; GC-poor, red