Download
1 / 6
60 likes | 201 Views
Rp095. 52. 1237. 3486. 3430. 2064. 727. Supplemental Fig. 1 Pedigrees for the seven unsolved arRP families. Arrows indicate the probands underwent molecular diagnosis. A. B. Affected sibling of Proband 2055. (b). (a). (c). C.

E N D
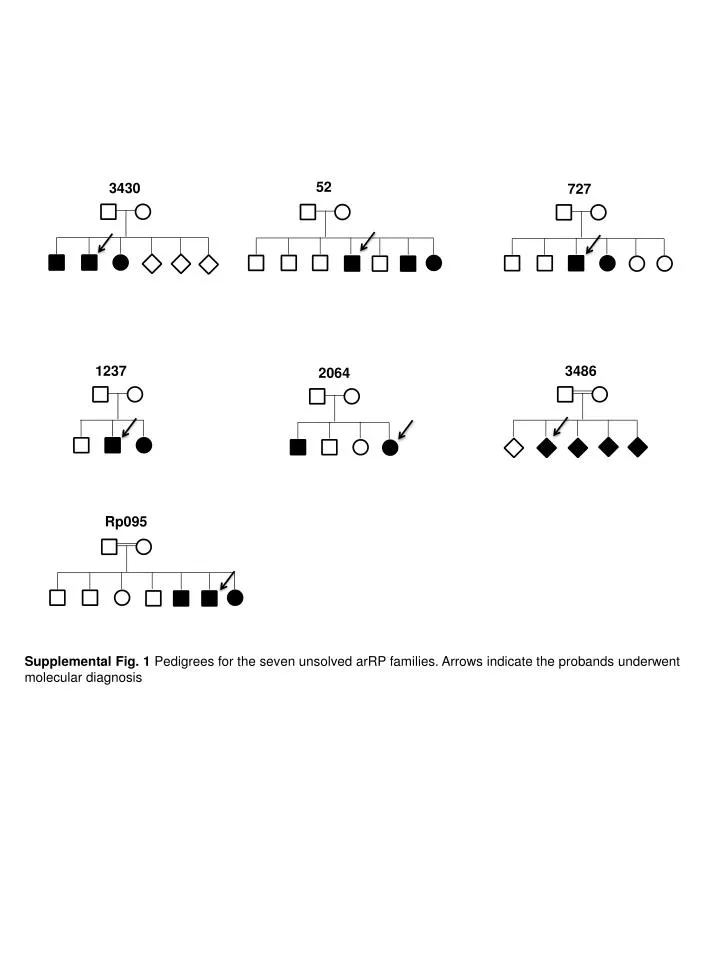
Rp095 52 1237 3486 3430 2064 727 Supplemental Fig. 1 Pedigrees for the seven unsolved arRP families. Arrows indicate the probands underwent molecular diagnosis
A B Affected sibling of Proband 2055 (b) (a) (c) C Supplemental Fig. 2 Fundus images of proband 2055’s affected sibling. Shown are (a) fundus photograph, (b) fundusautofluorescence (FAF) and (c) optical coherence tomography (OCT) images. The retinal photograph of the OD shows central choroidal sclerosis and peripheral pigment mottling. FAF shows a central hyperfluorescent ring surrounded by essentially normal FAF, surrounded by mottled FAF outside the arcades. OCT shows extensive IS/OS junction loss, except in the fovea
Proband 2044 (a) (b) Supplemental Fig. 3 Fundus images of proband 2044. Shown are (a) fundus photograph of OS, (b) fundusautofluorescence (FAF) of OS
Homozygosity mapping for proband 2691 Supplemental Fig. 4 Genome-wide analysis in proband 2691. Genotypes obtained with Affymetrix 250K SNPs chip were analyzed with the HomozygosityMapper software for the identification of large stretches of homozygosity. Top red bars indicate homozygous regions identified in DNA from proband 2691. As shown in the screen shot, three chromosomal regions of maximal homozygosity were identified. The widest region (8.02 Mb) corresponded to chromosome 16, from base 25,911,212 to base 33,940,200, and includes the CLN3 gene which extends from base 28,488,600 to base 28,503,623
Proband 2691 (a) (b) Supplemental Fig. 5 Fundus images of proband 2691. Shown are (a) fundus photograph of OD, (b) fundusautofluorescence (FAF) of OD
Proband SRF41 Supplemental Fig. 6 Fundus image of proband SRF41. Shown is fundus photograph of OS