Download
1 / 24

E N D
The Stream Restoration Toolbox The Stream Restoration Toolbox consists of current basic research cast into the form of tools that can be used by practitioners. The details of a tool are presented through a PowerPoint presentation, augmented by embedded Excel spreadsheets or other commonly available applications. The toolbox is a vehicle for bringing research findings into practice. While many tools are being developed by NCED Researchers, the opportunity to contribute a tool to the Toolbox is open to the community. For more information on how to contribute please contact Jeff Marr at marrx003@umn.edu.
Statement of liability and usage • This tool is provided free of charge. Use this tool at your own risk. In offering this tool, the following entities and persons do not accept any responsibility or liability for the tool’s use by third parties: • The National Center for Earth-surface Dynamics; • The universities and institutions associated with the National Center for Earth-surface dynamics; and • The authors of this tool. • Users of this tool assume all responsibility for the tool results and application thereof. The readers of the information provided by the Web site assume all risks from using the information provided herein. None of the above-mentioned entities and persons assume liability or responsibility for damage or injury to persons or property arising from any use of the tool, information, ideas or instruction contained in the information provided to you.
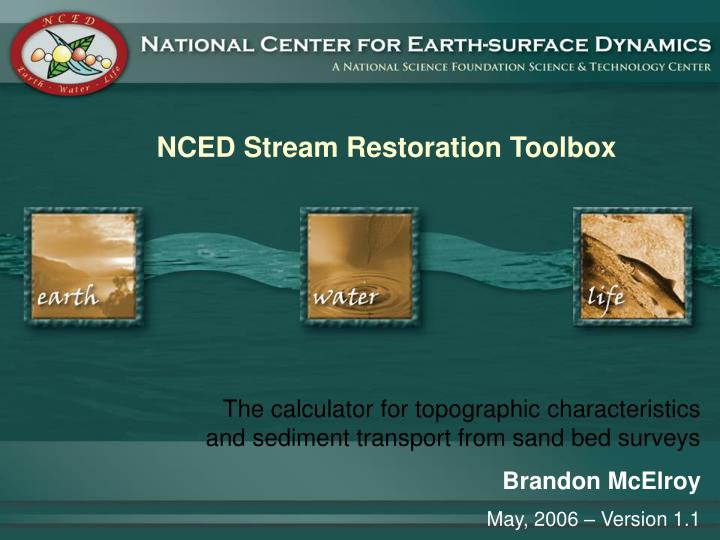
Title Page Tool Title: The calculator for topographic characteristics and sediment transport from sand bed surveys Tool Author: Brandon McElroy Author e-mail: bmcelroy@mit.edu Version: 1.1 Associated files: 1) SandBedCalc.ppt (this file) 2) SandBedCalc.xls Date: May, 2006
Outline of this Document • Limitations • Bed material load only, not total load • Requires high data integrity, accurate surveying • Minimum data standards • Motivation • A. Theoretic • Applied • Schematic Overview • Introduction to Tool • Theory Behind Tool • Characteristic Height & Length • Sediment Flux from Mass Conservation • Translation and Characteristic Velocity • Using the Tool • VII References
Warnings on tool limitations -Estimates of bed geometry and sediment transport produced with this tool are only snapshots of very dynamic systems and are only valid for the transport conditions under which bed was surveyed -Estimates of sediment flux produced with this tool are inherently limited by the quality of topographic data used to produce them -Minimum data standards for reliable tool accuracy -Ten or more characteristic dune lengths in total survey -Many tens of elevation measurements per characteristic dune length -Survey locations repeated within a very small fraction of characteristic dune length
Motivation THEORETIC -Characterizing bed topography and sediment transport in sandy systems is essential for elucidating underlying processes their relations -Using remote sensing methods, e.g. acoustic doppler, avoids effects of interfering with systems while collecting data, e.g. sediment traps APPLIED -Rates of sediment delivery to deltas are a fundamental part of their overall sediment budgets -Understanding effects of sediment loads on ecosystems requires information on sediment fluxes -Characterizations of channels for restoration necessitate transport rates to evaluate the stability of a reach
Tool Overview Input: 2 or more bed surveys Calculation based on mass conservation Output: Characteristic Values of Dune Height Dune Length Bed Translation Velocity Bed Deformation Rate Bed Material Sediment Flux
Introduction to the tool Under most conditions, sand bedded rivers transport sediment through through the propagation of topographic forms. Each sediment grain moves intermittently such that the bed topography is continually being recreated. In many sandy systems, there is very little sediment suspended into the flow and transported very large distances, but in some instances that style of transport can play a significant role. This tool does not specifically address that case, rather it is focused on the sediment that is an active part of the bed. A low altitude aerial photograph of the N. Loup River, Nebraska. The clarity of the water is indicative of the absence of suspended sediment. The complex bed topography can be seen as contrasts in color intensity. (from D. Mohrig)
Theory behind tool This profile comes from the photo in the previous slide and depicts well the complexity of the bed topography. The salient features can, however, be straightforwardly characterized by statistical measures of height and length. That is achieved by calculating the variability of elevations for profile subsets of many different lengths. It is called the roughness function. R = roughness function [m] L = profile subset length [m] N = number of profile subsets of length L η = bed elevation [m] ηL = mean bed elevation of subset [m] i = index of measurements [/] (1)
Theory behind tool The roughness plot has 2 distinct regimes. One in which R is nearly constant and another in which the slope of R is nearly constant. The value of R at large lengths is the saturation height. The mid point of the transition to constant slopes at lower R occurs at the saturation length. The saturation height and length are related proportionally to a characteristic height and length, respectively, by factors near 1. Saturation Height = 3.8cm Saturation Length = 190cm Plot of roughness function for profile in previous slide
Theory behind tool -- Initial Profile -- Subsequent Profile In the plot above, the 2 profiles were taken at the same location about half an hour apart, and the gray profile retains much of the form of the black profile. Specifically the bed has been acted upon in a way that gives the appearance that it has been both translated in the direction of sediment transport and that it has been deformed from its initial configuration. That behavior can be understood within the context of the conservation of mass of the bed sediment, i.e. Exner’s equation:
Theory behind tool Exner’s Equation qs= sediment flux [m2/s] x = position along profile [m] Cb= sediment concentration in bed [/] η = bed elevation [m] t = time [s] By using the chain rule in the right-hand side an equation that can be directly integrated is obtained. Vc is a characteristic velocity. This is the equation implemented in the accompanying Excel file to calculate sediment transport. (2)
z Vc H h x l Theory behind tool Traditionally, equation 2 has been evaluated for geometrically regular bed topography, as above, leading to the bedload equation. (Eq. 3; Simons, et al., 1971) Further, the constant of integration, qs0 had been assumed zero both for convenience and because is was argued to represent an otherwise negligibly small amount of transport via suspension. (3)
-- Initial Profile -- Subsequent Profile Theory behind tool This shows the same profiles as before separated by half an hour, but here the subsequent profile has been shifted backward by the translation length, the mean distance of bed propagation. It can be quickly seen that certain parts of the bed changed faster than others. (see red arrows) The deformation is then measured by the amount of non-overlapping area. The two equations below distinguish the parts of the total sediment flux, the translative flux and the deformative flux. Their sum is exactly equation 2.
-- Initial Profile -- Subsequent Profile Theory behind tool To determine the translation length, the evolved profile is cross-correlated with the initial profile. The resulting correlation function has a maximum at the translation length. The characteristic velocity, Vc is then the length divided by the time between surveyed profiles. cross-correlation function
Using the tool: step-by-step details 1-Preparing your data (in a separate spreadsheet) The first step in using this tool is to ensure that your data is formatted appropriately for the excel macro. Following these guidelines will do just that. - All data should conform to these units lengths, depths/heights: meters [m] time: hours [hr] (e.g. 1 hour 15 minutes = 1.25) - If data are in other units, convert them into the above units - Use this convention: depth measurements (i.e. water surface as datum) are negative numbers height measurements (i.e. datum below sediment bed) are positive numbers - Profiles should have similar extents. Prior to using data, delete any portions of profiles that do not overlap in space.
Using the tool: step-by-step details 2-Importing your data After completing step 1, copy data into the DataInput sheet as shown below. - All profiles must be defined at the same positions for the analysis. To that end, the original profiles can be resampled in the ‘DataInput’ page. Resampling is accomplished after the analysis positions are created.
Using the tool: step-by-step details 2-Importing your data (continued) - Analysis positions (brown column) are calculated from 3 parameters: starting position, position spacing, and final position. The starting position is arbitrary, the spacing should be the average distance between survey measurements, and the final position is determined by the following formula final position = start position + (spacing * total survey points) - In this case there are 1550 point measurements spaced 2cm apart, and the start position was set to zero for convenience.
Using the tool: step-by-step details 2-Importing your data (continued) - After creating the analysis positions, copy a profile into the light blue columns labeled ‘Input’ for resampling. The dark blue columns labeled ‘Output’ will then contain a resampled profile (i.e. values of profile interpolated at analysis positions). The ‘Output’ column should be copied to the ‘DataAnalysis’ sheet. - The positions should be copied once into the far left column in the ‘DataAnalysis’ sheet as shown below. Thereafter, only the ‘depth’ data is needed. For the remaining profiles, simply copy each new profile into the next column in ‘DataAnalysis’ sheet after resampling.
Using the tool: examples -In the example show here, 3 profiles each containing 1550 point measurements were used to calculate bed material flux over a 35 minute interval. The characterization of the bed and its deformation is reported in the upper left corner. -Height --> characteristic height -Length --> characteristic length -Velocity --> characteristic velocity -Deformation Flux --> percent magnitude of total sediment flux (i.e. 100*Qsd/Qs) -Bed Material Flux --> total volumetric flux of sediment per unit width
References Simons, D. B., Richardson, E. V., and Nordin, C. F., Jr. (1965). “Bedload equation for ripples and dunes,” U.S. Geological Survey Professional Paper 462-H. + + + +
Disclaimer Notice The information on this site is subject to a disclaimer notice. Thank you for visiting the National Center for Earth Dynamics Web site and reviewing our disclaimer notice. The Web site is for informational purposes only and is not intended to provide specific commercial, legal or other professional advice. It is provided to you solely for your own personal use and not for purposes of distribution, public display, or any other uses by you in any form or manner whatsoever. The information on this Web site is offered on an “as is” basis without warranty. The readers of the information assume all risks from using the information provided herein. • This tool is provided free of charge. Use this tool at your own risk. In offering this tool, the following entities and persons do not accept any responsibility or liability for the tool’s use by third parties: • The National Center for Earth-surface Dynamics; • The universities and institutions associated with the National Center for Earth-surface dynamics; and • The authors of this tool. • Users of this tool assume all responsibility for the tool results and application thereof. The readers of the information provided by the web site assume all risks from using the information provided herein. None of the above-mentioned entities and persons assume liability or responsibility for damage or injury to persons or property arising from any use of the tool, information, ideas or instruction contained in the information provided to you.
Want more information? For more information on this tool or the NCED Stream Restoration Toolbox please contact the author of this tool, Brandon McElroy, or the NCED Stream Restoration Project Manager, Jeff Marr at marrx003@umn.edu National Center for Earth-surface Dynamics 2 3rd Ave SE, Minneapolis, MN 55414 612.624.4606