Download
1 / 36
670 likes | 1.61k Views
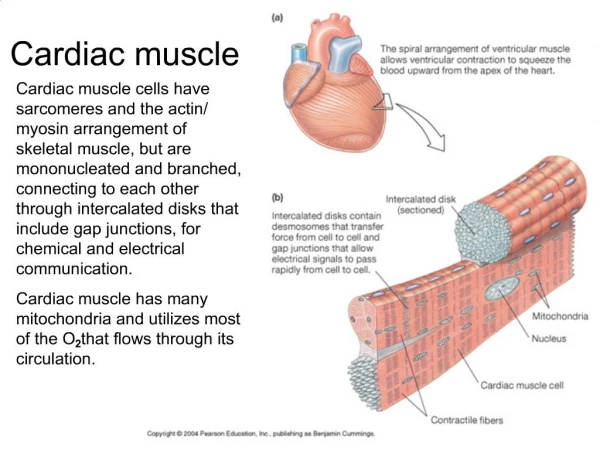
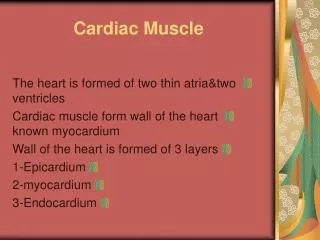
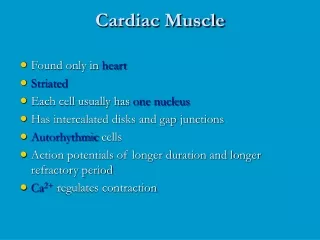
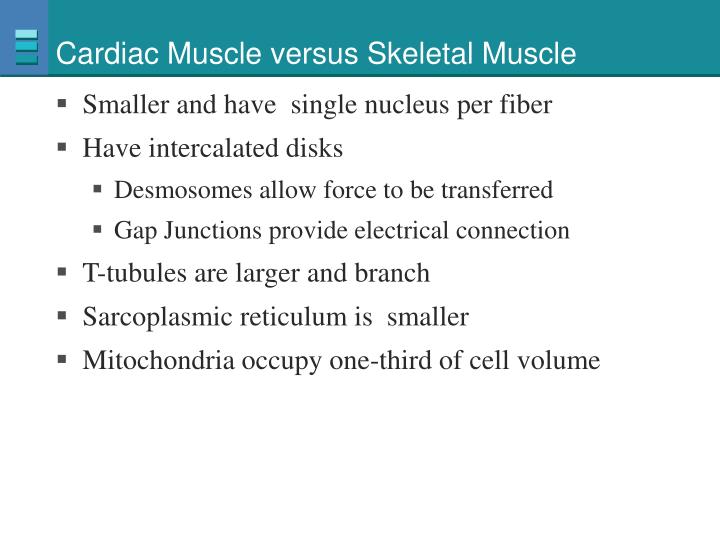
Cardiac Muscle versus Skeletal Muscle. Smaller and have single nucleus per fiber Have intercalated disks Desmosomes allow force to be transferred Gap Junctions provide electrical connection T-tubules are larger and branch Sarcoplasmic reticulum is smaller

E N D
Cardiac Muscle versus Skeletal Muscle • Smaller and have single nucleus per fiber • Have intercalated disks • Desmosomes allow force to be transferred • Gap Junctions provide electrical connection • T-tubules are larger and branch • Sarcoplasmic reticulum is smaller • Mitochondria occupy one-third of cell volume
Anatomy: Cardiac Muscle Figure 14-10
Cardiac Muscle 1 Action potential enters from adjacent cell. ECF 1 ICF Ryanodine receptor-channel SR Sarcoplasmic reticulum (SR) T-tubule Excitation-contraction coupling and relaxation in cardiac muscle Figure 14-11, step 1
Cardiac Muscle 1 Action potential enters from adjacent cell. Ca2+ ECF 1 2 Voltage-gated Ca2+ channels open. Ca2+ enters cell. ICF Ryanodine receptor-channel 2 SR Sarcoplasmic reticulum (SR) T-tubule Figure 14-11, steps 1–2
Cardiac Muscle 1 Action potential enters from adjacent cell. Ca2+ ECF 1 2 Voltage-gated Ca2+ channels open. Ca2+ enters cell. ICF Ryanodine receptor-channel 3 Ca2+ induces Ca2+ release through ryanodine receptor-channels (RyR). 2 3 SR Sarcoplasmic reticulum (SR) Ca2+ T-tubule Figure 14-11, steps 1–3
Cardiac Muscle 1 Action potential enters from adjacent cell. Ca2+ ECF 1 2 Voltage-gated Ca2+ channels open. Ca2+ enters cell. ICF Ryanodine receptor-channel 3 Ca2+ induces Ca2+ release through ryanodine receptor-channels (RyR). 2 3 SR Sarcoplasmic reticulum (SR) 4 Local release causes Ca2+ spark. Ca2+ T-tubule 4 Ca2+ spark Figure 14-11, steps 1–4
Cardiac Muscle 1 Action potential enters from adjacent cell. Ca2+ ECF 1 2 Voltage-gated Ca2+ channels open. Ca2+ enters cell. ICF Ryanodine receptor-channel 3 Ca2+ induces Ca2+ release through ryanodine receptor-channels (RyR). 2 3 SR Sarcoplasmic reticulum (SR) 4 Local release causes Ca2+ spark. Ca2+ T-tubule 5 Summed Ca2+ Sparks create a Ca2+ signal. 4 Ca2+ spark 5 Ca2+ signal Figure 14-11, steps 1–5
Cardiac Muscle 1 Action potential enters from adjacent cell. Ca2+ ECF 1 2 Voltage-gated Ca2+ channels open. Ca2+ enters cell. ICF Ryanodine receptor-channel 3 Ca2+ induces Ca2+ release through ryanodine receptor-channels (RyR). 2 3 SR Sarcoplasmic reticulum (SR) 4 Local release causes Ca2+ spark. Ca2+ T-tubule 5 Summed Ca2+ Sparks create a Ca2+ signal. 4 Ca2+ spark Ca2+ ions bind to troponin to initiate contraction. 6 5 Ca2+ signal 6 Contraction Figure 14-11, steps 1–6
Cardiac Muscle 1 Action potential enters from adjacent cell. Ca2+ ECF 1 2 Voltage-gated Ca2+ channels open. Ca2+ enters cell. ICF Ryanodine receptor-channel 3 Ca2+ induces Ca2+ release through ryanodine receptor-channels (RyR). 2 3 SR Sarcoplasmic reticulum (SR) 4 Local release causes Ca2+ spark. Ca2+ T-tubule 5 Summed Ca2+ Sparks create a Ca2+ signal. 4 Ca2+ spark Ca2+ ions bind to troponin to initiate contraction. 6 5 7 Relaxation occurs when Ca2+ unbinds from troponin. Ca2+ signal Ca2+ 7 6 Actin Myosin Relaxation Contraction Figure 14-11, steps 1–7
Cardiac Muscle 1 Action potential enters from adjacent cell. Ca2+ ECF 1 2 Voltage-gated Ca2+ channels open. Ca2+ enters cell. ICF Ryanodine receptor-channel 3 Ca2+ induces Ca2+ release through ryanodine receptor-channels (RyR). 2 3 SR Sarcoplasmic reticulum (SR) Ca2+ stores 4 Local release causes Ca2+ spark. Ca2+ T-tubule 5 Summed Ca2+ Sparks create a Ca2+ signal. 4 ATP Ca2+ spark Ca2+ 8 Ca2+ ions bind to troponin to initiate contraction. 6 5 7 Relaxation occurs when Ca2+ unbinds from troponin. Ca2+ signal Ca2+ 8 Ca2+ is pumped back into the sarcoplasmic reticulum for storage. 7 6 Actin Myosin Relaxation Contraction Figure 14-11, steps 1–8
Cardiac Muscle 9 1 Action potential enters from adjacent cell. Ca2+ Ca2+ 3 Na+ ECF 1 2 Voltage-gated Ca2+ channels open. Ca2+ enters cell. ICF Ryanodine receptor-channel Ca2+ 3 Ca2+ induces Ca2+ release through ryanodine receptor-channels (RyR). 2 3 SR Sarcoplasmic reticulum (SR) Ca2+ stores 4 Local release causes Ca2+ spark. Ca2+ T-tubule 5 Summed Ca2+ Sparks create a Ca2+ signal. 4 ATP Ca2+ spark Ca2+ 8 Ca2+ ions bind to troponin to initiate contraction. 6 5 7 Relaxation occurs when Ca2+ unbinds from troponin. Ca2+ signal Ca2+ 8 Ca2+ is pumped back into the sarcoplasmic reticulum for storage. 7 6 Actin 9 Ca2+ is exchanged with Na+. Myosin Relaxation Contraction Figure 14-11, steps 1–9
Cardiac Muscle 9 10 1 Action potential enters from adjacent cell. Ca2+ Ca2+ 3 Na+ 2 K+ ECF 1 ATP 2 Voltage-gated Ca2+ channels open. Ca2+ enters cell. ICF 3 Na+ Ryanodine receptor-channel Ca2+ 3 Ca2+ induces Ca2+ release through ryanodine receptor-channels (RyR). 2 3 SR Sarcoplasmic reticulum (SR) Ca2+ stores 4 Local release causes Ca2+ spark. Ca2+ T-tubule 5 Summed Ca2+ Sparks create a Ca2+ signal. 4 ATP Ca2+ spark Ca2+ 8 Ca2+ ions bind to troponin to initiate contraction. 6 5 7 Relaxation occurs when Ca2+ unbinds from troponin. Ca2+ signal Ca2+ 8 Ca2+ is pumped back into the sarcoplasmic reticulum for storage. 7 6 Actin 9 Ca2+ is exchanged with Na+. 10 Na+ gradient is maintained by the Na+-K+-ATPase. Myosin Relaxation Contraction Figure 14-11, steps 1–10
Cardiac Muscle Contraction • Can be graded (skeletal muscle is all-or-none) • Sarcomere length affects force of contraction Length-tension relationship of cardiac muscle • 1% of myocardial cells are autorhythmic (pacemaker) cells that set the rate of the heartbeat but do not contribute directly to contractile force.
Regulation of Heart Pumping • Intrinsic Regulation: The Frank-Starling Mechanism • This reflects the intrinsic ability of the heart to adapt to increasing volumes of inflowing blood. • The greater the heart muscle is stretched during filling, the greater is the force of contraction and the greater the quantity of blood pumped into the aorta. Or, stated another way: Within physiologic limits, the heart pumps all the blood that returns to it by the way of the veins.
The Frank-Starling Mechanism When an extra amount of blood flows into the ventricles, the cardiac muscle itself is stretched to greater length. This in turn causes the muscle to contract with increased force because the actin and myosin filaments are brought to a more nearly optimal degree of overlap for force generation. Therefore, the ventricle, because of its increased pumping, automatically pumps the extra blood into the arteries.
Regulation of Heart Pumping • Extrinsic Regulation: Autonomic Nervous System • Sympathetic stimulation--NE • Strong stimulation can increase heart rate (HR) from normal rate of 70 bpm to 200-250 bpm. • Increases force of contraction, thus increasing volume of blood pumped and increasing ejection pressure. • Parasympathetic (Vagal) stimulation--Ach • Strong stimulation can even stop heartbeat for a few sec. • Mainly decreases HR but also causes small decrease in strength of heart contraction.
Myocardial Contractile Cells PX = Permeability to ion X PNa 1 +20 2 PK and PCa 0 -20 PK and PCa 3 0 -40 Membrane potential (mV) PNa -60 -80 4 4 -100 0 100 200 300 Time (msec) Phase Membrane channels 0 Na+ channels open 1 Na+ channels close 2 Ca2+ channels open; fast K+ channels close 3 Ca2+ channels close; slow K+ channels open 4 Resting potential Action potential of a cardiac contractile cell Figure 14-13
Myocardial Contractile Cells PX = Permeability to ion X +20 0 -20 0 -40 Membrane potential (mV) PNa -60 -80 -100 0 100 200 300 Time (msec) Phase Membrane channels 0 Na+ channels open Figure 14-13, step 0
Myocardial Contractile Cells PX = Permeability to ion X PNa 1 +20 0 -20 0 -40 Membrane potential (mV) PNa -60 -80 -100 0 100 200 300 Time (msec) Phase Membrane channels 0 Na+ channels open 1 Na+ channels close Figure 14-13, step 0–1
Myocardial Contractile Cells PX = Permeability to ion X PNa 1 +20 2 PK and PCa 0 -20 0 -40 Membrane potential (mV) PNa -60 -80 -100 0 100 200 300 Time (msec) Phase Membrane channels 0 Na+ channels open 1 Na+ channels close 2 Ca2+ channels open; fast K+ channels close Figure 14-13, steps 0–2
Myocardial Contractile Cells PX = Permeability to ion X PNa 1 +20 2 PK and PCa 0 -20 PK and PCa 3 0 -40 Membrane potential (mV) PNa -60 -80 -100 0 100 200 300 Time (msec) Phase Membrane channels 0 Na+ channels open 1 Na+ channels close 2 Ca2+ channels open; fast K+ channels close 3 Ca2+ channels close; slow K+ channels open Figure 14-13, steps 0–3
Myocardial Contractile Cells PX = Permeability to ion X PNa 1 +20 2 PK and PCa 0 -20 PK and PCa 3 0 -40 Membrane potential (mV) PNa -60 -80 4 4 -100 0 100 200 300 Time (msec) Phase Membrane channels 0 Na+ channels open 1 Na+ channels close 2 Ca2+ channels open; fast K+ channels close 3 Ca2+ channels close; slow K+ channels open 4 Resting potential Figure 14-13, steps 0–4
Refractory periods and summation in skeletal and cardiac muscle Figure 14-14c
Action Potentials in Cardiac Autorhythmic Cells If channels are permeable to both K+ and Na+ Figure 14-15
Modulation of Heart Rate by the Nervous System Figure 14-16
Electrical Conduction in Myocardial Cells Figure 14-17
Electrical Conduction in Heart 1 1 SA node AV node 1 THE CONDUCTING SYSTEM OF THE HEART SA node depolarizes. SA node Internodal pathways AV node A-V bundle Bundle branches Purkinje fibers Purple shading in steps 2–5 represents depolarization. Figure 14-18, step 1
Electrical Conduction in Heart 1 1 SA node AV node 2 1 THE CONDUCTING SYSTEM OF THE HEART SA node depolarizes. 2 Electrical activity goes rapidly to AV node via internodal pathways. SA node Internodal pathways AV node A-V bundle Bundle branches Purkinje fibers Purple shading in steps 2–5 represents depolarization. Figure 14-18, steps 1–2
Electrical Conduction in Heart 1 1 SA node AV node 2 1 THE CONDUCTING SYSTEM OF THE HEART SA node depolarizes. 2 Electrical activity goes rapidly to AV node via internodal pathways. SA node 3 Internodal pathways 3 Depolarization spreads more slowly across atria. Conduction slows through AV node. AV node A-V bundle Bundle branches Purkinje fibers Purple shading in steps 2–5 represents depolarization. Figure 14-18, steps 1–3
Electrical Conduction in Heart 1 1 SA node AV node 2 1 THE CONDUCTING SYSTEM OF THE HEART SA node depolarizes. 2 Electrical activity goes rapidly to AV node via internodal pathways. SA node 3 Internodal pathways 3 Depolarization spreads more slowly across atria. Conduction slows through AV node. AV node Depolarization moves rapidly through ventricular conducting system to the apex of the heart. 4 A-V bundle 4 Bundle branches Purkinje fibers Purple shading in steps 2–5 represents depolarization. Figure 14-18, steps 1–4
Electrical Conduction in Heart 1 1 SA node AV node 2 1 THE CONDUCTING SYSTEM OF THE HEART SA node depolarizes. 2 Electrical activity goes rapidly to AV node via internodal pathways. SA node 3 Internodal pathways Depolarization spreads more slowly across atria. Conduction slows through AV node. 3 AV node 4 Depolarization moves rapidly through ventricular conducting system to the apex of the heart. A-V bundle 4 Bundle branches Purkinje fibers Depolarization wave spreads upward from the apex. 5 5 Purple shading in steps 2–5 represents depolarization. Figure 14-18, steps 1–5
Transit through A-V node delays ventricular depolarization • Reduction in numbers of gap junctions decreases the rate of conduction through A-V node
Electrical Conduction • AV node • Direction of electrical signals • Delay the transmission of action potentials • SA node • Set the pace of the heartbeat at 70 bpm • AV node (50 bpm) and Purkinje fibers (25-40 bpm) can act as “ectopopic” pacemakers under some conditions