Download
1 / 25
250 likes | 334 Views
ForecastingVolatility of Portfolios of Indexes. A Portfolio Management’s Perspective Silverio Foresi Quantitative Strategies Group Goldman Sachs Asset Management. Key Points. Smoother Models, Multivariate Volatility decoupling volatilities from correlations Portfolios Diagnostics

E N D
ForecastingVolatility of Portfolios of Indexes A Portfolio Management’s Perspective Silverio Foresi Quantitative Strategies Group Goldman Sachs Asset Management
Key Points • Smoother Models, Multivariate Volatility • decoupling volatilities from correlations • Portfolios Diagnostics • optimal portfolios and their problems • scatterplot diagnostics work with Giorgio De Santis and Adrien Vesval at GSAM
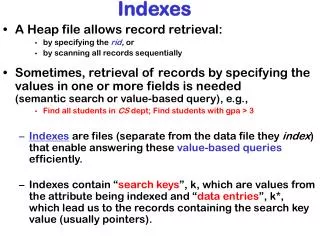
Covariance Matrix Returns in excess of expectations
Portfolio Variance • Variance • Variance of portfolio w
Forecasting with Smoothers • Moving averages of n obs • Exponential smoothing of n obs • P controls “persistence” of vol estimates
Generalized Smoothers • Vec model (Engle) • Very highly parameterized • Special cases • Baba, Engle, Kroner, and Kraft • C = 0, AB appropriate scalars: exp. smoother
Volatilities and Correlations • Variance decomposition • Constant correlation model (Bollerslev) • univariate GARCH for volatilities • constant correlations • Dynamic correlation (Engle , Engle & Sheppard) • univariate GARCH for D • time-varying R estimated by exponential smoothing on the residuals of GARCH
Multi-Decay Model • Different persistence for volatilities, Pi • Common persistence for correlations, Pcor • Assembly
Multi-Decay Model (2) • Q-MLE: estimates for Pcor, PEQ, PFI, PFX • …Pcor = PEQ = PFI = PFX? • No • Volatilities differ by asset class PEQ = 0.65, PFI = 0.66, and PFX= 0.58 • Correlations move more slowly than volatilities Pcor = 0.97 • Details: De Santis-Vesval (2001)
Interesting Portfolios • Mean/Variance • Global Minimum Variance • Minimum Tracking Error ... optimal portfolios depend on estimated covariance matrix
Problem with Optimal Portfolios • Example: true PEQ is low • if one uses low PEQ =Pcor : optimal portfolios change too fast (chasing correlations) ... underestimate vol • use high PEQ may look better on average • Implications • it may help decouple correlations from volatilities • it may help to have diagnostics based on portfolios independent of estimated covariance
Other Interesting Portfolios • Equilibrium • Equally weighted • Random ... do not depend on estimated cov
Experiments Pcor = PEQ • Simulated Data • Random Portfolios, no benchmanrk, sum to 1 • Real Data: • Equity Returns for 18 Country Indexes from 5/5/1983 to 3/29/2002 (4931 daily obs) • Random Portfolios, no benchmanrk, sum to 1 • Optimal Portfolio • cash benchmark (zero beta) • target TE = 7.5%
Diagnostics: Smoothing Forecasts Consider many portfolios wp(p = 1, 2, ... ,P) • Calculate Vart-1(wp’rt) for all t,p • Assign portfolios to bins,by forecastedVar • average forecasts of all portfolios in every bin • average realizations in every bin Average out forecast error • Diagnostics based on scatterplot • realizations vs forecasts • vs other characteristics (past e2, corr?) • nonlinearities
Simulated Data Random Portfolios
More Diagnostics Standardized portfolio residuals Distribution • Unconditional • is E(e) = 0 and E(e2) = 1? • Conditional: can we explain e or e2 -1 with • lags of past e and e2? (autocorrelation) • sign of past e or e2 -1?
Simulated Data Random Portfolios
Simulated Data Random Portfolios vol sinusoidal
Real Data Random Portfolios Interesting region
Real Data Min TE Portfolio
Real Data Min TE Portfolio
Back to Key Points • Decoupling volatilities from correlations • Correlations move more slowly than vols • Portfolios Diagnostics • Random portfolios allow us to average out forecast errors • Nonlinearities (scatterplot diagnostics)
Diagnostics for Covariance Matrix Use estimated Covariance to standardize residuals Distribution • Unconditional • is E(e) = 0 and E(e * e’) = I? • Conditional: can we explain e or e2 -1 with • lags of past e and e2? (autocorrelation) • sign of past e or e2 -1?