Download
1 / 15
150 likes | 678 Views
DEBIRI TACE Patterns and Predictors of Response. Robert Jones. Declaration Robert Jones is a consultant to Biocompatibles UK LTD. Pathological response to chemotherapy predicts survival. 100 90 80 70 60 50 40 30 20 10 0. Complete response. % survival. Major response. Minor

E N D
DEBIRI TACE Patterns and Predictors of Response Robert Jones Declaration Robert Jones is a consultant to Biocompatibles UK LTD.
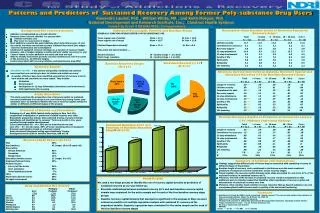
Pathological response to chemotherapy predicts survival 100 90 80 70 60 50 40 30 20 10 0 Complete response % survival Major response Minor response 2 5 8 1 4 7 10 0 3 6 9 Years Blazer, JCO 2008
55% 30% 15% Pathological Response Rates after Treatment 70 60 50 40 30 20 10 0 55% FOLFOX/FOLFIRI DEBIRI-TACE 36% % patients 9% Minor Major Complete Pathological response
Metabolism of Irinotecan (CPT-11) Blood CPT-11 APC CYP3A4 CPT-11 SN-38 CES2 Topo-1
“…tumour CES2 expression may contribute to variable response to irinotecan containing chemotherapy” Clinical Cancer Research 2002; 8: 2605-11
“…23 fold variation in CES-2 expression in colon cancers, which directly correlated with conversion from irinotecan to SN-38” Clinical Cancer Research 2003; 9: 4983-91
“Absolute levels of CES-2 appear highest in hepatic parenchyma, with colorectal primary tumour having levels two to three fold lower” British Journal of Cancer 1999; 80: 364-70
“Only 10% of cells need to express CES-2 for 48% growth suppression…..bystander growth suppression may play a role in the effect of CPT-11 ” Journal of Clinical Investigation 1998; 101:1789-96
Hypothesis Variation in pathological response to DEBIRI-TACE is due to inter-patient variation in metabolism of Irinotecan • Metabolism within tumour • Metabolism in surrounding tissue
Identification of Biomarkers • Prognostic • Predictive
Fresh metastatic tumour Fresh hepatic tissue FFPE primary tumour
Immunohistochemistry • Primary tumour • Metastatic tumour • Hepatic parenchyma CES-2 in primary colorectal cancer CYP3A4 in hepatic parenchyma
Wide variation in response to DEBIRI-TACE Exploration of reasons behind variation in response will define approach to treatment Identification of potential biomarkers of response will help guide personalisation of therapy Summary