Download
1 / 10
110 likes | 115 Views
Medicare Advantage: Background and Current Status. by Marsha Gold, Sc.D. Senior Fellow Mathematica Policy Research, Inc. May 4, 2008 Presented at Alliance for Health Reform Briefing. Origins of Medicare Advantage. TEFRA of 1982 (effective 1985): Medicare Risk Contracting (HMO) Program

E N D
Medicare Advantage: Background and Current Status by Marsha Gold, Sc.D. Senior FellowMathematica Policy Research, Inc. May 4, 2008 Presented at Alliance for Health Reform Briefing
Origins of Medicare Advantage • TEFRA of 1982 (effective 1985): Medicare Risk Contracting (HMO) Program • BBA of 1997: Medicare+Choice (additional local coordinated care choices, PFFS, rate floors and other changes); subsequent refinements (BIPA and others) • MMA of 2003: immediate payment changes (increases) 2004-2005, SNPs • MMA of 2003 (effective 2006): Part D, regional PPOs, MSAs, payment benchmarks
Medicare Private Plan Enrollment by Contract Type, 1999–2009 Source: CMS Monthly Summary Report, December various years; March for 2009. Note: “Other” include 1876 cost plans, 1833 cost plans (HCPPS), PACE and demonstrations.
Percentage of Beneficiaries with MA Choice in Urban and Rural Areas, 1999-2009 Urban Counties Rural Counties Source: MPR analysis of publicly available CMS data.
Percentage of Beneficiaries by Number of Firms Competing for MA Business, 2009 Source: MPR analysis of CMS data from the Contract-County file for March 2009. Excludes sponsors offering group-only products. CCP = HMO and PPO aIncludes 12 percent with no choice, 12 percent with 1 sponsor choice, 11 percent with 2 choices, and 24 percent with 3-4 choices.
Distribution of Total MA Enrollment by Firm or Affiliate, 2009 a Source: MPR analysis of CMS’s Contract-County file for March 2009. aWellPoint has a 4 percent market share including BC-BS affiliates. (BC-BS has 14.3 percent without WellPoint.)
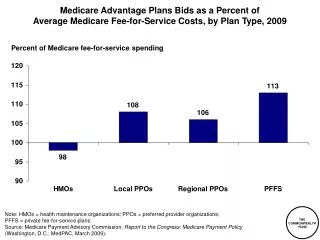
MA-PD Premiums by Plan Type (Weighted by Enrollment), 2009 Source: MPR analysis of CMS’s Medicare Options Compare, CMS’s March 2009 enrollment data. Note: Statistics exclude group and SNP plans.
Estimated Annual Out-of-Pocket Costs for Hospital and Physicians Services Differ by Plan Type and Enrollee Health Status, 2009 Source: MPR analysis of CMS’s Medicare Options Compare data. Uses assumptions of hospital and physician use based on HealthMetrix Note: Statistics are enrollment-weighted (March 2009) and exclude group and SNP plans. aAssumes a mix of 72 percent healthy, 19 percent with episodic needs, and 9 percent with chronic needs, which is equal to the distribution of community-residing beneficiaries in good, fair, and poor health. bAssumes enrollees’ use of in-network benefits. Includes provider-sponsored plans.
Distribution of Beneficiaries by Number of Individual MA Plans Available, 2009 Source: MPR analysis of CMS data. Note: Excludes SNP and group plans.
Where We Are Now • MA enrollment now almost a quarter of beneficiaries and adds to Medicare costs • PFFS disporportionately accounts for growth (and availability in rural areas) • Many firms compete but most enrollment concentrated in a few • Premiums are attractive but financial risk remains • Beneficiaries asked to distinguish numerous and diverse plans.