Download
1 / 15
150 likes | 158 Views
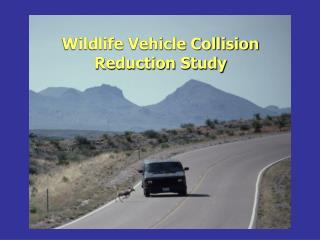
ODOT Wildlife Collision Hotspots Study. RESULTS OF STATEWIDE ANALYSIS August 26, 2008. Melinda Trask Oregon Department of Transportation, Geo-Environmental Section, Salem OR Francesca Cafferata-Coe, Jessica Burton, Ellen Voth, and John Lloyd, Mason, Bruce & Girard, Inc., Portland OR.

E N D
ODOT Wildlife Collision Hotspots Study RESULTS OF STATEWIDE ANALYSIS August 26, 2008 Melinda Trask Oregon Department of Transportation, Geo-Environmental Section, Salem OR Francesca Cafferata-Coe, Jessica Burton, Ellen Voth, and John Lloyd, Mason, Bruce & Girard, Inc., Portland OR
Types of Wildlife Collision Data • Focused Road Kill Observations • Possible to get accurate location and species info. • Most expensive • Expert Opinion • Good for first cut; precursor to focused studies • Subjective; not empirical • Crash Records • Used for national statistics • Limited subjective reporting • Data quality cannot be verified • Dispatch Carcass Reports • Most comprehensive option • Data quality cannot be verified
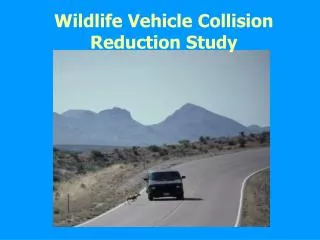
Oregon's Highway Animal-Vehicle Collisions • CRASH RECORDS: • Avg. 400 wildlife collisions per year, past 14 years • About 5,500 records statewide • Less than 3% of all crash reports in Oregon • 15 fatalities & 117 serious injuries in 14 years • Crash records represent only a small portion of actual animal-vehicle collisions nationally (less than 10% of actual; per literature) • Dispatch Carcass Records • 6 times more data in similar period • Represents avg. 2,600 wildlife collisions per year, past 12 years • About 32,000 records statewide in OR (12 years)
ODOT Wildlife Collision Prevention Plan • Addressing wildlife passage is supported by the Governor and ODOT’s current mission and goals, and particularly within the values of safety, accountability, and environmental stewardship. • Current lack of information - we cannot adequately address the problem. • Do we have a significant statewide road kill problem or just in some areas? • Need to prioritize wildlife movement corridors and highway barrier problem areas to make science-based and cost-effective decisions, versus ad-hoc. • Need better tools to adequately address wildlife passage. • Non-regulated but supported by FHWA, ODFW, USFWS, CETAS, nationwide attention.
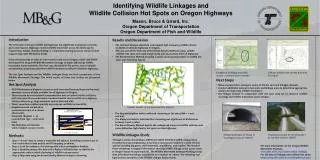
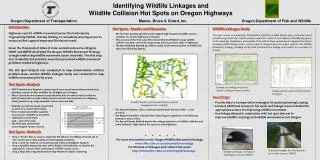
US Hwy ODOT Wildlife Collision Hot Spot Analysis • Uses existing carcass pick-up records • Statewide, analytical approach • Identify high frequency wildlife-vehicle collision zones • Conducted pilot study in D10 to fine tune methods and determine the feasibility of statewide analysis Density: low medium high
Data Preparation - Methods • 3 different types of record keeping • Wildlife Incident Reports, call = RDKILL • Animal Type, Deer & Elk • Consistent Dates, 12 yeas of data (1995-2006) • Location, +/- 0.5 mile • Link Location to GIS Coordinates
Original # Records 31,595 (100%) Step 1 - Data Processing Narrowing Acceptable Parameters 25,216 (80%) (20% reduction) Cut out records older than 1995, duplicate records, non deer/elk, low precision (> 0.5 mi) Tabular Information Problems 21,335 (68%)(12% reduction) Poor location, highway nomenclature, or MP Not enough information in recorded data MP not referenced Step 2 - Linkage to GIS GIS Mapping Problems 17,824 (56%)* (11% reduction) Route ≠ ODOT Highway number * Final number of "good" records used in data analysis. Data Preparation - Results
Results: Kernal Density Evaluation • Produces an estimate of risk for each point. • Highlights highway segments with higher density probabilities than others • Results Depend on: • Density of points • Relative proximity of points • Study area • Method of categorizing • Ranking or # “bins”
Discussion • This study did not address why hotspots are found in these areas. • vehicle speed, traffic volume, movement barriers, adjacent habitat structure, animal distribution, travel corridors, etc. • Necessary to make sound management decisions • Potential uses of this data: • Planning (NEPA process, one of many types of data) • Project Scoping (one of many types of data) • Project Development (project-specific; up to Regions) • Typically will require more research; Hwy 97 example
Discussion • ODOT can pay for wildlife crossing improvements • Justified under PD-04 • FHWA Enhancement program (Category 11) • Oregon Transportation Plan (Goal 4.1.1) • SAFETEA-LU Section 148 (approved uses of safety funds) • Hazard Elimination Program (HEP) • Highway Safety Improvement Program (HSIP) • Wildlife passage typically not regulated • How does it affect Maintenance? • Future data collection?