Download
1 / 7
70 likes | 250 Views
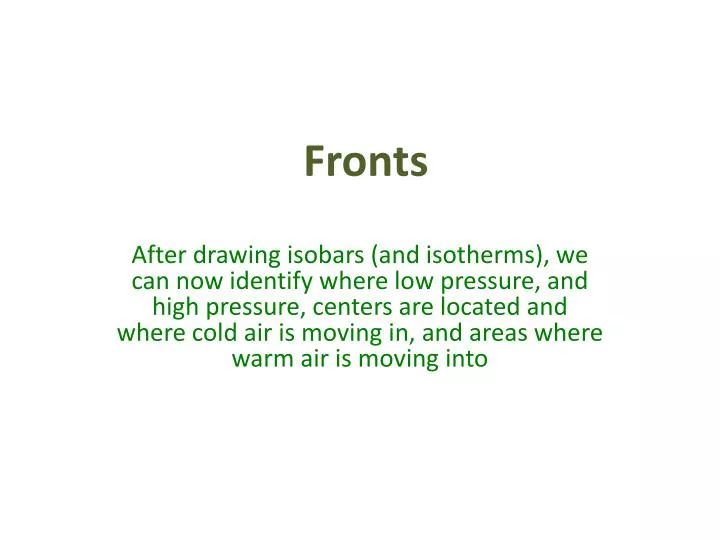
Fronts. After drawing isobars (and isotherms), we can now identify where low pressure, and high pressure, centers are located and where cold air is moving in, and areas where warm air is moving into. Please remember: Wind is named by the direction it is coming from.

E N D
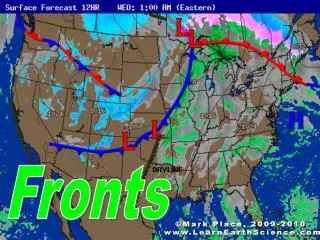
Fronts After drawing isobars (and isotherms), we can now identify where low pressure, and high pressure, centers are located and where cold air is moving in, and areas where warm air is moving into
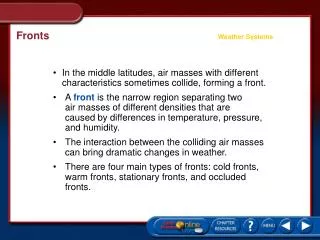
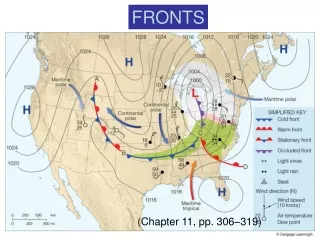
Please remember: Wind is named by the direction it is coming from. Focus on Northand South wind North wind is associated with colder air, and southerly wind is associated with warmer air. In this diagram south wind is over the southeastern areas of the US, and over the central area of the US the wind is out of the north. The circulation around a surface Low pressure center is referred to as cyclonic. The cold front is a symbol that represents the leading edge of the cold air. In the diagram above the colder air is in place over the central states. This cold sector of the Low, and is referred to as the back side of the Low and the cold sector
The horizontal perspective It’s important to understand The vertical and horizontal dynamics of colder air moving into an area and located on the back side of Low pressure and in the cold sector. Imagine this is you (or me) in the next slide.
See the small circle inside the square? It represents you standing in the warm sector, and ahead of the cold front. warm sector with south wind cold sector with north wind In this diagram (above) we are looking down onto the atmosphere and we can only see the top of your head. Next, look at you In the vertical perspective on the next slide
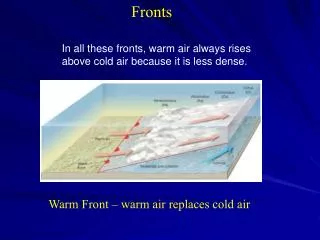
The vertical perspective Here below we can see all of you (look below) standing in the warm air sector. The cold air is moving in. At the front edge of the cold air storm cloud development is most likely. This is were thunderstorms are expected and the clouds build. Warm air Review this presentation again; making sure you understand what cyclonic circulation Is referring to (it’s important to understand).
See the small circle inside the square? It represents you standing ahead of the warmer air. warm sector with south wind cold sector with north wind In this diagram (above) we are looking down onto the atmosphere and we can only see the top of your head. Next, look at you In the vertical perspective on the next slide
The vertical perspective ahead of warm air... In this diagram, we see the vertical perspective again. You are standing ahead of warm air. The leading edge of the warm air is not inducing the storm clouds like the leading edge of the colder air in a previous diagram. It is common to get light rain (and even snow) ahead of the warm front. Next , look at the video on Air Flow and Circulation.