Download
1 / 57
620 likes | 947 Views
Evidence Based Practice An introduction of Systematic Review and Meta-analysis. 陳立佳 Dr. Li-Chia Chen Drug Usage and Pharmacy Practice Research Group, School of Pharmacy and Pharmaceutical Sciences, The University of Manchester 高雄醫學大學 94 教學卓越計畫 - 教師成長獎助方案 , 20/12/2005. 系列演講簡介.

E N D
Evidence Based PracticeAn introduction of Systematic Review and Meta-analysis 陳立佳 Dr. Li-Chia Chen Drug Usage and Pharmacy Practice Research Group, School of Pharmacy and Pharmaceutical Sciences, The University of Manchester 高雄醫學大學94教學卓越計畫- 教師成長獎助方案, 20/12/2005
系列演講簡介 高雄醫學大學94教學卓越計畫- 教師成長獎助方案, 20/12/2005
The name behind The 'Cochrane' Collaboration (http://www.cochrane.org/docs/archieco.htm) Where Is EBM From? • 1972: Archie Cochrane • The ideas have been extended back to mid-19th century post-revolutionary Paris. • 1992: Evidence-Based Medicine (EBM) was named by a group led by Gordon Guyatt at McMaster University in Canada. • 1992: Centre for Evidence-Based Medicine in Oxford was established • 1993: The Cochrane Collaboration was founded in 1993. • Effectiveness and Efficiency: Random Reflections on Health Services, 1972 • Limited resources should be used to provide equitably those forms of health care which had been shown in properly designed evaluations to be effective • Using evidence from randomised controlled trials (RCTs): • likely to provide much more reliable information than other sources of evidence
Best research evidence Clinical expertise Patient values What Is Evidence Based Medicine? • EBM is the process of systematically reviewing, appraising and using clinical research finding to aid the delivery of optimum clinical care to patients. (Roseneberg & Donald 1995, BMJ; 310(6987):1122-6) • EBM is the integration of best research evidence with clinical expertise and patient values. (Sackett at al. 2000, Evidence-based Medicine, Ontario) The best available data Decision-making in selecting a treatment
Results of Medical Treatments EFFICACY EFFECTIVENESS EFFICIENCY • Does it contribute to a more efficient use of resources? • Dose it work in a controlled environment (RCT)? • Does it work in clinical practice? • Does it work in real environment? • Dose it work in real life? Social parameter Medical parameter OUTCOME RESEARCH OUTCOMES Economic parameter
Experimental studies Randomized controlled trials Quasi-randomised controlled trials Non-randomised trials Observational studies Controlled observational studies Observational studies without controls Evidence of Causation STRONG WEAK (from Sackett and colleagues)
Levels of Evidence * Met when all patients died before the Rx became available, but some now survive on it; or when some patients died before the Rx became available, but none now die on it. Produced by Bob Phillips, Chris Ball, Dave Sackett, Doug Badenoch, Sharon Straus, Brian Haynes, Martin Dawes since November 1998 (http://www.cebm.net/levels_of_evidence.asp#levels)
Clinical Effectiveness Assurance • EBM forms part of the multifaceted process of assuring clinicaleffectiveness, the main elements of which are: -through research and scientific review Production of evidence Production and dissemination of evidence-based clinical guidelines • Critical appraisal • Systematic review & meta-analysis -through education and management of change Implementation of evidence-based, cost-effective practice Evaluation of compliance with agreed practice guidance and patient outcomes -this process includes clinical audit
What Is A Systematic Review? • A concise summary of all the best evidence on a specific question • Systematic reviews are scientific investigations in themselves… • The synthesis the results of multiple primary investigations by using strategies that limit bias and random error.(Cook et al. Ann Int Med 1997;126(5):376-80) • These strategies included a comprehensive search of all potentially relevant articles and the use of explicit, reproducible criteria in the selection of articles of review. • Primary research designs and study characteristics are appraised, data are synthesis, and results are interpreted.
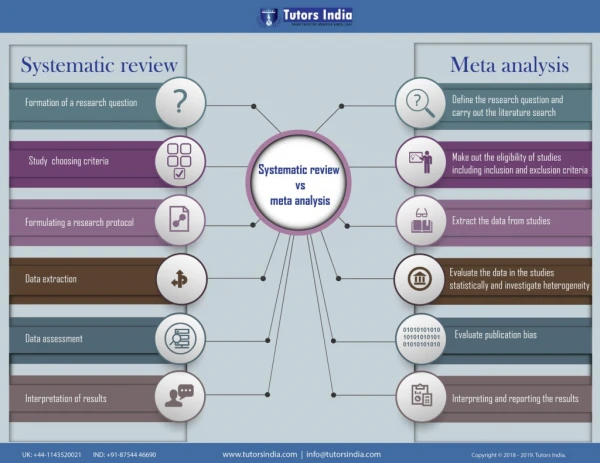
Reviews Systematic reviews Meta-analysis How Is This Different From A Review? • Literature reviews are usually one individual’s opinions of the current stage of knowledge. • This is inevitably limited and form a partial perspective.
What Can A Systematic Review Offer? • A summary of information (2,000,000 biomedical articles published annually) • Assessment of whether multiple studies are consistent, and can be generalised or vary by population subsets • Limiting bias helps to improve reliability and accuracy of results • Combing results can increase power and precision of estimates of effectiveness • When few or no studies are found this can help to pinpoint crucial area and questions that need further research
A question Protocol Check need, state objectives outline eligibility criteria protocol Search for studies Assess for inclusionCompile dataset (quality, data extract) Analyses results using meta-analysis, sensitivity, subgroup analysis? Structured report of review The Process of A Systematic Review Stage I Planning the review 1. Preparation of proposal for review 2. Development of review protocol Stage II Conducting a review 3. Identification of research 4. Selection of studies 5. Study quality assessment 6. Data extraction 7. Data synthesis Stage III Reporting and dissemination 8. Report and recommendations http://www.york.ac.uk/inst/crd/dialogsearch.htm 9. Getting evidence in practice
What Is a Good Systematic Review? • Is there a clearly focussed questions? • How well have they searched for all the studies that might be relevant? • How well have studies have been filtered to select those that meet to review’s criteria?Has the quality of studies been assessed? • How well have the results been synthesised?How skilled was the analysis and interpretation? (the CASP criteria are useful, see http://www.phru.nhs.uk/casp/casp.htm )
Where Can I Find Systematic Reviews? • The best source of systematic reviews: • The Cochrane Library • The Cochrane Database of systematic reviewsDatabase of Abstracts of Reviews of Effectiveness (DARE)(Controlled trials register) • Training materials:http://www.arif.bham.ac.uk/strategy.htm#Systematic • Cochrane Collaboration:http://www.cochrane.org/index0.htm
Why Might I Want to Conduct One Systematic Review? • To answer a clinical question • To produce a top quality publication • To highlight areas where further research is needed • To influence practice • A part of a comprehensive body of work in an area
Formulate our questions- PICO • Write your questions in the following way: • Then we get really specific: • Q: Clinical efficacy of selective COX-2 inhibitors used in post-operative pain management Participants Intervention Comparison Outcomes Patients who are due to have surgery COX-2 inhibitors for postoperative pain control Placebo or NSAIDs or opioid-containing agents Pain score, QoL, LoS, satisfaction, mobility…after treatment Who would be included/exclude? pregnant women? Would single oral drugs be OK? Any combination treatment? Type of drugs, dose, frequency, duration? How about placebo? other pain control agents? Do these outcomes matter to people? What about QoL?
This Specific Question: • Is the lynchpin of your systematic review protocol • Lead on to your inclusion and exclusion criteria • Helps you build your search strategy • Get you thinking about what data to extract and what quality criteria are important • Allows you to decide on your analysis
Example of A Cochrane Review • Work though the process of a Cochrane review on the long term effects of advice to reduce salt intake
1. Well Formulated Question Participants Intervention Comparison Outcomes Health people, may have raised BP Advice to reduce dietary salt People without this advice Illness, death, QoL, BP, urinary sodium excretion at least 6 month later Who would we include/exclude? Pregnant women?) Would a leaflet be okay? Meal provided ? Advice to reduce salt and increase potassium? How about ‘placebo’ advice? or support groups? Do these outcomes matter to people? What about QoL?
Qualification of researchers Search strategy, including time period Databases and registries searched Search software used, name, version and special features used Hand-searching Citations located and those excluded Methods of addressing non-English language articles Methods of addressing non-English language articles Method of handling abstracts/unpublished studies Description of an contact with authors http://www.shef.ac.uk/scharr/ir/netting/ 2. Comprehensive Data Search (Stroup et al. 2000)
http://www.york.ac.uk/inst/crd/search.htm Search Strategies
3. Unbiased Selection and Abstraction Process • What might you improve the inclusion/exclusion sheet to better fit with the thrust of the review?
4. Validity Assessment of Papers • What question will you ask about validity for this review? • How dose the study measure up? Internal validity External validity The degree to which the results of a study are likely to approximate to the ‘truth’ for the circumstances being studied. The degree to which the effects observed in the study are applicable to the outside world. Randomised controlled trials Epidemiological studies (case-control or cohort study) Selection Comparability Outcome Randomisation Selection bias Blinding Performance bias Detection bias Attrition bias Completeness of follow-up/intend-to-treat Newcastle-Ottawa Scale for cohort study Crombie 1996; NHS CRD 2001 Downs and Black, 1998 Five points score: Jadad et al. 1996; Checklist (CRD handbook; Downs and Black, 1998 ) and Cohen’s Kappa for allocaiton
5. Data Extraction • Extract the relevant data form the study (Brown et al. 2003)
Example of HPT • Extract data from HPT trial • SD=SE* n
6. Synthesis of data • Data from randomised controlled trials: • Meta-analysis • Non-randomised controlled studies: • Statistical combination should not be a prominent part of the review (Egger at al, 2001) • Exploration of possible source of heterogeneity may be more informative • Individual patient data would allow more thorough investigation
7. Result Presentation Hooper, L. et al. BMJ 2002;325:628
What Is Meta-analysis? • Definition: • A quantitative method of combining the results of independent studies and synthesising summaries and conclusions which can be used to evaluate therapeutic effectiveness, plan new studies, etc., with application chiefly in the area of research and medicine. (National Library of Medicine, 1989) • The process of using statistical methods to combine the results of different studies. • The aim is to integrate the findings, pool the data, and identify the overall trend of results. (Dictionary of epidemiology, 1995)
Why Use Meta-analysis? • Individual studies often not large enough • Greater generalisability • Quantitative and more objective • Begin to see where an intervention act differently in different groups.
Basic Considerations • Experimental vs. non-experimental • Study design • Year of publication or study conduct • Languages • Choice among multiple publications • Restrictions due to sample size or follow-up • Similarity of treatment and/or exposure (homogeneity) • Completeness of information
Forest Plot or Blobbograms • Comparison between groups shown for each individual study • 95% confidence interval for each comparison shown • Diamond at bottom summarises the results for all the studies Hooper, L. et al. BMJ 2002;325:628
How Accurate Is the Difference? And Estimate of Overall Effect -5 -4 -3 -2 -1 0 1 2 3 4 5 • Confidence interval: the range of plausible values for the true effect, generally use 95% certainty • Estimate of overall effect: • Based on weight average of results of individual studies. More precise estimates given more weight. • Point estimate of the treatment effect and the confidence interval.
Choice of Summary Statistic • Based on different type of data Continuous data Dichotomous data Blood pressure / weight / amount of pain Illness or not / death or not / birth or not • Weight mean difference • Studies have used the same scales. • The ‘weight’ is related to the inverse of the variance. • Standardised mean difference • Studies that have used different scales. • The mean difference may be divided by an estimate of the with-in group standard derivation to produce a standardised value without any units. • Odds ratio (OR) • Relative risk or risk ratio (RR) • Percent risk reduction, or relative risk reduction (RRR) • Risk difference, or absolute risk reduction (RD) • Number needed to treat (NNT; 1/RD) NHS CRD report 4, 2001
Odds ratio = a/b ÷ c/d Relative risk = a/(a+b) ÷ c/(c+d) Risk difference (Absolute Risk Reductions) = a/(a+b) -c/(c+d) NNT= 1÷ ARR = IMPact = number of patients given an active treatment achieving success TOTact = total number of patients given the active treatment IMPcon = number of patients given a control treatment achieving success TOTcon = total number of patients given the control treatment (Bandolier 1999, Issue 59) 1 (IMPact / TOTact) (IMPcon / TOTcon) Dichotomous Data Presentation
Dose nicotine replacement therapy (NRT) help people stop smoking? RCT of RCT in General Practice in Oxford Jamrozik (1984) How large is the difference? 10.0% vs. 8.2% Relative risk (RR) of 10.0/8.2=1.21 21% increase in cessation rate compared with control Odds Ratio For mathematical convenience, studies often use the odd ratio (OR) instead of the relative risk Odds=number of quit / number of don’t quit Will usually give similar answers to RR (but exaggerates unless event is rare) In this case 1.24 Example of NRT
Results of NRT Systematic Review • If the odds ratio or relative risk is 1 then the effect in the intervention is the same as the effect in the control group • If the odds ratio or relative risk is greater than 1 then the effect in the intervention groups is greater than in the control group • Note: the effect may be good or bad, e.g. recovery or death
The variability in the reported effect size between studies Are the different among the results of the trials greater than could be expected by chance alone? Identifying heterogeneity Forrest plot: see how well CIs overlap Perform 2 (chi-squared) test Odds Ratio (95%CI) Odds Ratio (95%CI) 1 1 Heterogeneity Heterogeneity Homogeneity
Heterogeneity (Chi-Squared Test) • P<0.1 demonstrates statistically significant heterogeneity • May not be appropriate to pool data • For example: Chi square=172.97 df=2 p<0.1
Analogy of ANOVA by Cochran Model 1: Fixed effect model Model 2: Random effect model Model 3: Mixed effect model (Random effect regression model) Trend or ‘dose response’ analysis Statistical approaches to publication bias Cumulative meta-analysis: tend can be identifies (Lau et al. 1998) Meta analysis using p value (Jones 1995) Statistical Methods For Continuous Effect Measures Embraced in Statistic software, such as Review Manager (RevMan) or STATA
Statistical Methods For Dichotomous Effect Measures Fixed effect Effect measure Pro and Con Random effect Effect measure Pro and Con Mental-Haenszel methods OR 1. UMP test 2. Simple to use 3. Software available 4. Need complete 2 by 2 tables 5. Ignore confounders Der-Simonian and Laird method OR 1. Differ from fixed model, only if there is lack of homogeneity 2. Does not account for heterogeneity 3. Does not correct for bias 4. Failure to control for confounding 5. Failure to control for other cause of lack of homogeneity Peto method OR 1. Simple to use 2. Need complete 2 by 2 tables 3. Ignore confounders 4. Biased if unbalanced General variance-based methods DR, RR, OR (For cumulative incidence data) 1. Good for RD 2. Difficult to calculate 3. Ignore confounders 4. No advantage over Mental- Haenszel if for OR General variance-based method RR, OR (used of confidence interval) 1. Only RR and confidence interval are required 2. Do not ignore confounders 3. Few studies will be excluded
Odds Ratio (95%CI) 1 Random or Fixed Effects? Random error Random error Trial specific effect Result Result True effect True mean effect
Subgroup Analysis • Often of interest to examine a particular category of participants in a review • This may be done when the heterogeneity between studies is significant (may ‘explain’ heterogeneity) • Example: women, a particular age group, or those with a specific disease subgroup • Often misleading • Can produce false negative/false positive results • Misleading for future research • Is there indirect evidence in support of a difference? • Did the hypothesis about the difference precede rather than follow the hypothesis?
Example of Subgroup Analysis • Late night versus lots of sleep
An analysis used to determine how sensitive the results of a study or systematic review are to the way it has be done Sensitivity analyses are used to assess how robust the results are to uncertain decisions or assumption about the data and the methods that were used. Can be used for taking the quality of the studies into account in the meta-analysis Meta Regression Used to suggest reasons for observed heterogeneity. Attempts to identify significant relations between dependent variable and independent variable. Odds Ratio (95%CI) Odds Ratio (95%CI) 1 1 Sensitivity Analysis