Download
1 / 27
310 likes | 830 Views
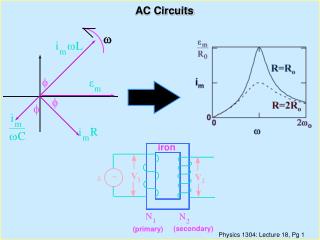
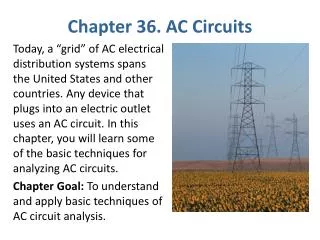
AC Circuits. AC Current peak-to-peak and rms Capacitive Reactiance magnitude and phase Inductive Reactance magnitude and phase. V p V pp V rms. AC Circuits. AC Signals and rms Values

E N D
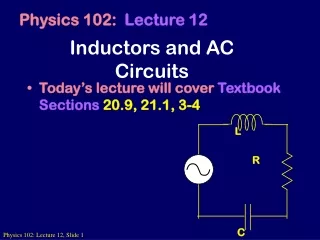
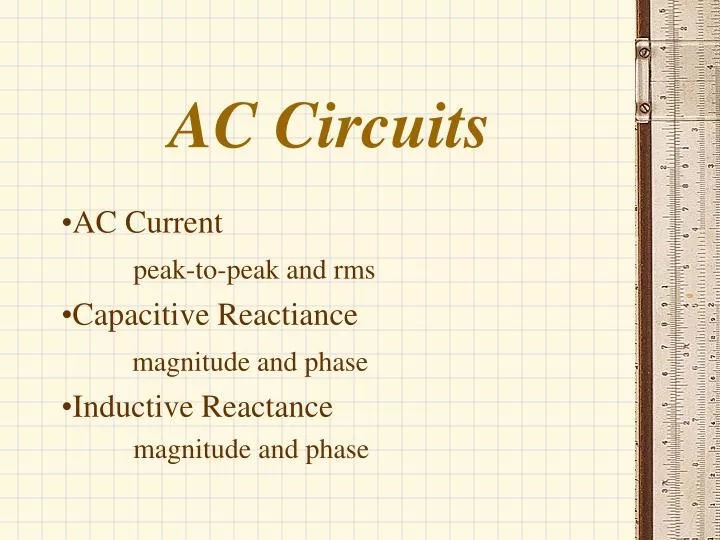
AC Circuits AC Current peak-to-peak and rms Capacitive Reactiance magnitude and phase Inductive Reactance magnitude and phase
Vp Vpp Vrms AC Circuits AC Signals and rms Values • There are a number of ways to describe the current or voltage for a time varying signal: peak value, peak-to-peak, and rms. Write in your own words what each means and indicate the three values on the sine wave signal shown below.
AC Circuits • What is V average, Vave? • How is Vrms related to Vm? We will derive this in a minute. When you measure an ac current or voltage with a DMM you are measuring rms values.
AC Circuits • Connect the cables from the Signal/Function Generator and the voltage input cables to the 2.2 kW resistor on the E&M board. The red and black cables with the red and black plugs are the input to the voltage sensor. Make sure the two grounds (black cables) are connected to the same side of the resistor. Start DataStudio and configure the program to measure voltage using channel A. You will recall that you do this by clicking and dragging the plug icon to channel A and choosing Voltage Sensor. For output we will connect both the digital output and the oscilloscope. Connect both to channel A. • Next select the Signal/Function Generator by clicking the Signal icon on the lower left side of the DataStudio window. Set the amplitude to 5 volt and the frequency to 100 Hz on the function generator. Select the sine wave (AC) and click ON. • Measure the peak value and the peak-to-peak value using the oscilloscope and measure the rms value using the digital meter.
AC Circuits • Measure the peak value and the peak-to-peak value using the oscilloscope and measure the rms value using the digital meter. Vm = Vpp = Vrms = • What is the ratio of Vrms to Vp? Vrms/Vp = 0.707 • Is this what you expect? Explain. Yes, at least we expect the value to be less than one.
AC Circuits • The rms value is found by squaring the signal, integrating over one period, and then taking the square root. Lets do it. First square the following signal. V(t) = Vpsin(wt) • Now integrate this with respect to time from t = 0 to t = T (the period). Look in Appendix A page A-10 for the integral. Hint: What is wT? • Finally, dividing by T and take the square root you should get V2(t) = Vp2sin2(wt)
AC Circuits Resistance, Capacitance, and Inductance • When we discuss resistors, capacitors, and inductors in a circuit there are two important points to remember. • The magnitude relationship between the current in and voltage across a resistor, capacitor, or inductor. • The phase relationship between the current in and voltage across a resistor, capacitor, or inductor.
AC Circuits Resistance • The simplest case is a resistor in a circuit. • The current and voltage are in phase • The magnitude is VR=IR The current and voltage are in phase in a resistor. Current and voltage reaches a minimum at time T
Current reaches a minimum at time T Voltage reaches a minimum at a later time T+DT AC Circuits Capacitive Reactance • When we discuss capacitors in a circuit there are two important points for a capacitor. One is the phase relationship between the current in and voltage across a capacitor. What is the phase relationship? This is the bold statement on page 855 in your text. The current in a capacitor leads the voltage by 900.
Like AC Circuits • The second point is the magnitude relationship between current and voltage for a capacitor. What is this relationship? • This is equation (33-5) in your text. To make this look like Ohms law we define capacitive reactance. What is the definition for capacitive reactance? • What are the units? ohms
AC Circuits • Let’s check this out. Connect the 2.2 kW resistor on the E&M board in series with the 0.047 mF capacitor to the output of the function generator. Set the amplitude to 5 volts, the frequency to 200 Hz, and the function to sine wave. Connect the voltage probes to the Pasco 750 Interface across the resistor. To get the phase correct connect the black voltage lead to one side of the resistor and connected the ground lead (black cable) from the ground side of the signal generator. We will also measure the voltage across the capacitor by connecting the leads from channel B across the capacitor. Make sure the positive lead is connected to the positive side of the capacitor. This is the side connected to the positive lead from the signal generator. You need to click the plug icon and drag it to channel B and choose Voltage Sensor. To connect the output to the oscilloscope do not open a new window but go to the oscilloscope window and click the second trace icon (Which should be No Signal) on the right and select Channel B.
AC Circuits • Measure the peak voltage across the resistor and the capacitor. Use the resistance to calculate the peak current. Record the values in the table below. Change the frequency and repeat the measurements. frequency voltage voltage current capacitive (resistor) (capacitor) reactance Hz Vp (V) Vp (V) Ip (mA) XC (W) ____20__ __________ __________ __________ __________ __2000__ __________ __________ __________ __________
AC Circuits • Measure the peak voltage across the resistor and the capacitor. Use the resistance to calculate the peak current. Record the values in the table below. Change the frequency and repeat the measurements.
Yes! So it should look like a 1/x curve AC Circuits • Use DataStudio or open Excel and plot the capacitive reactance as a function of frequency. Does the curve look like what you would expect from the definition of capacitive reactance? Explain.
So slope equals 1/2pC AC Circuits • Use the definition to figure out how to plot the data so that you get a straight line. Replot the data and do a linear fit. From the slope calculate the capacitance.
AC Circuits • Next we will measure the phase shift between the voltage across the capacitor and the current through the capacitor. Set the frequency to 2000 Hz. Make sure both positive voltage leads are connected to the side connected to the positive side of the signal generator. The two traces should look like Figure 33-4.
T t AC Circuits • Measure the phase difference between the current and voltage. Do this by measuring the period which is 3600 and the time shift between the two signal. Then q = 3600 t/T where t is the time shift and T is the period. • Change the frequency and see if the phase difference between the two signals changes.
Voltage reaches a maximum at time T Current reaches a maximum at a later time T+DT AC Circuits • Inductive Reactance • When we discuss inductors in a circuit there are two important points for an inductor. One is the phase relationship between the current in and voltage across an inductor. What is the phase relationship? This is the bold statement at the bottom of page 836 in your text. The voltage across an inductor leads the current by 900.
AC Circuits • The second point is the magnitude relationship between current and voltage for a inductor. What is this relationship? • This is equation (33-7) in your text. To make this look like Ohms law we define inductive reactance. What is the definition for inductive reactance? • What are the units? ohms
X (ohms) L f (1/sec) AC Circuits • On the axis below show what you expect for the inductive reactance as a function of frequency.
AC Circuits • Replace the capacitor with the inductor in the circuit. Using the digital meter measure the voltage across the inductor and resistor as we did for the capacitor. frequency voltage voltage current capacitive (resistor) (capacitor) reactance Hz Vp (V) Vp (V) Ip (mA) R (W) ____20__ __________ __________ __________ __________ __2000__ __________ __________ __________ __________
AC Circuits • Measure the peak voltage across the resistor and the inductor. Use the resistance to calculate the peak current. Record the values in the table below. Change the frequency and repeat the measurements.
Yes! So t he slope is 2pL. The inductance is AC Circuits • Plot the inductive reactance as a function of frequency. Does the graph agree with what you know about inductive reactance?
AC Circuits • Measure the phase shift between the current and voltage across the inductor. Your two traces should look like Figure 33-6.
AC Circuits Summary of AC circuit equations This is everything you need to know from today
AC Circuits Summary of AC circuit concepts This is a little more than you want to know!
AC Circuits • Phase shift and Phasors