Download

1 / 13
170 likes | 346 Views
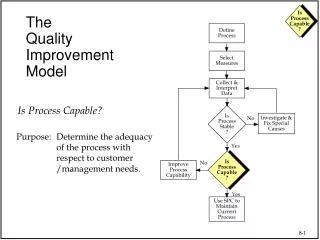
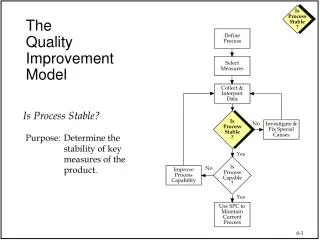
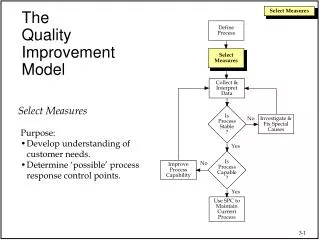
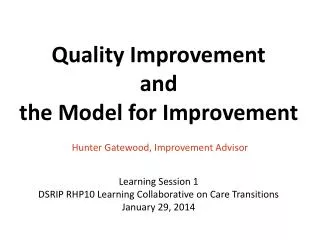
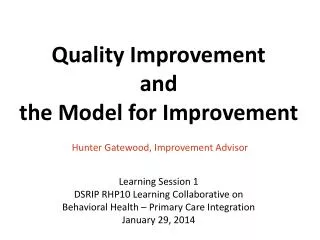
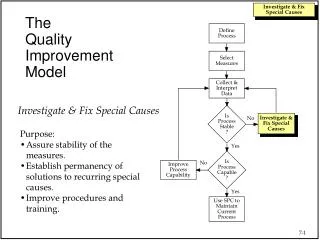
The Quality Improvement Model. Define Process. Select Measures. Collect & Interpret Data. Is Process Stable?. Is Process Stable ?. No. Investigate & Fix Special Causes. Purpose: Determine the stability of key measures of the product. Yes. Is Process Capable ?. No.

E N D
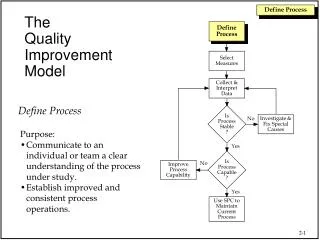
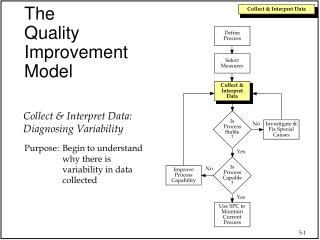
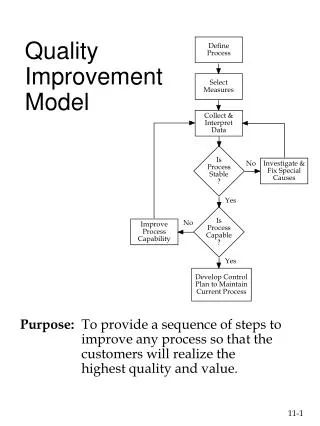
TheQualityImprovementModel Define Process Select Measures Collect & Interpret Data Is Process Stable? IsProcessStable? No Investigate & Fix Special Causes Purpose: Determine the stability of key measures of the product. Yes IsProcessCapable? No Improve Process Capability Yes Use SPC to Maintain Current Process
Types of VariationCommon Causes Causes that are inherent in the process over time, and affect all outcomes of the process. • Ever-present • Create small, random fluctuations in the process • Lots of them • The sum of their effects creates the expected variability • Predictable Run Chart Quality Characteristic Time
Types of VariationSpecial Causes • Causes that are not present in the • process all the time, but arise • because of specific circumstances. • Not always present in the process • Can create large process disturbances, or sustained shifts • Relatively few in number • Pull the process beyond the expected level of variability • Unpredictable Run Chart Quality Characteristic Time Control charts help identify the presence of special causes.
Control Chart UCL CL LCL 2 4 6 8 10 12 14 16 18 20 22 24 26 28 30 32 Run Order Control Chart Components • Run chart of the data • Center Line (CL) • A line at the average of the data or target of the process • Upper Control Limit (UCL) • A line at the upper limit of expected variability • Lower Control Limit (LCL) • A line at the lower limit of expected variability The control limits are based on data collected from the process.
Rules for Separating Common & Special Causes Two commonly used signals of special causes are: Rule 1: Any point above the Upper Control Limit (UCL) or below the Lower Control Limit (LCL) Rule 2: 8 points in a row on the same side of the center line (CL) Note: Additional rules do exist.
Process Stability Stable Process A process in which the key measures of the output from the process show no signs of special causes. Variation is a result of common causes only. Unstable Process A process in which the key measures of the output from the process show signs of special causes in addition to common causes. Variation is a result of both common and special causes.
A Stable Process U C L • • • • • • • • • • • • • • • • • • • • • • • • • • • • • • • • • • • • • • • • • • • • • • • • • • • • • • • • • • • • • • • • • • • • • • • • • • • • • • • • L C L C o m m o n C a u s e s A l o n e A r e A t W o r k : • B e h a v e s i n a R a n d o m M a n n e r • N o C y c l e s • N o R u n s • N o T r e n d s • N o S h i f t s • N o D e f i n e d P a t t e r n s
Un-Stable Process • • • • U C L • • • • • • • • • • • • • • • • • • • • • • • • • • • • • • • • • • • • • • • • • • • • • • • • • • • • • • • • • • • • • • • • • • • • • • • • • • • • • L C L A s s i g n a b l e C a u s e ( s ) A r e P r e s e n t I n A d d i t i o n T o C o m m o n C a u s e V a r i a t i o n L o o k F o r : • P o i n t s O u t s i d e t h e C o n t r o l L i m i t s • S h i f t s • C y c l e s • R u n s • T r e n d s
Control Chart 5 b* Histogram 4 LS US 3 UCL=2.2 2 Avg=1.4 1 LCL=0.5 0 0 1 2 3 4 5 20 40 60 80 100 120 140 Sample b* Polymer Manufacturing Data Note: b* is a measure of yellowness Histogram does not show whether the process is stable!
Histograms & Control Charts • Control Charts • Real-time evaluation • Help identify presence of special causes • Assess past and present stability of process Histograms • Plot past data • Cannot tell if process is stable • Only useful for prediction if the process is stable
20 18 16 14 12 10 8 6 4 2 0 IsProcessStable? Pump Maintenance Data Number of Failures UCL=11.4 Avg=4.8 LCL=None 2 4 6 8 10 12 14 16 18 20 22 24 Week Are there any signals of special causes? Circle them.