Download
1 / 24
240 likes | 246 Views
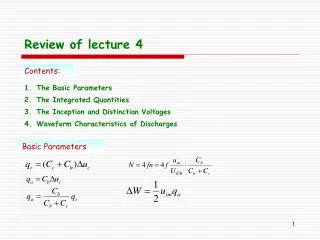
Lecture 4 Covariation of parameter values. Scales of life 8a. 30. Life span 10 log a. Volume 10 log m 3. earth. 20. 10. life on earth. whale. whale. 0. bacterium. ATP molecule. -10. bacterium. -20. water molecule. -30. Bergmann 1847. Dwarfing in Platyrrhini 8.1.2. 180 g.

E N D
Scales of life 8a 30 Life span 10log a Volume 10log m3 earth 20 10 life on earth whale whale 0 bacterium ATP molecule -10 bacterium -20 water molecule -30
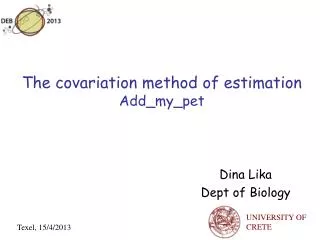
Dwarfing in Platyrrhini 8.1.2 180 g Cebidae 130 g Saimiri 200-400 g Saguinus 400-535 g 480-700 g 400-450 g 780-1250 g 700-1000 g 3500 g Callitrix Callimico Cebuella Leontopithecus MYA Mico Aotus 24.8 20.2 Perelman et al 2011 Plos Genetics7, 3, e1001342 Cebus
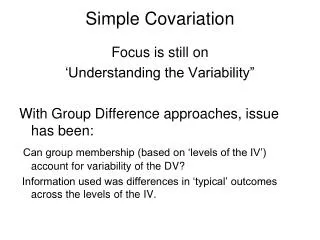
Inter-species body size scaling • parameter values tend to co-vary across species • parameters are either intensive or extensive • ratios of extensive parameters are intensive • maximum body length is • allocation fraction to growth + maint. (intensive) • volume-specific maintenance power (intensive) • surface area-specific assimilation power (extensive) • conclusion : • write physiological property as function of parameters • (including maximum body weight) • evaluate this property as function of max body weight Kooijman 1986 Energy budgets can explain body size scaling relations J. Theor. Biol.121: 269-282
Body weight Body weight has contributions from structure and reserve If reserve allocated to reproduction hardly contributes:
Scaling of metabolic rate Respiration: contributions from growth and maintenance Weight: contributions from structure and reserve Structure ; = length; endotherms
Metabolic rate slope = 1 Log metabolic rate, w O2 consumption, l/h 2 curves fitted: endotherms 0.0226 L2 + 0.0185 L3 0.0516 L2.44 ectotherms slope = 2/3 unicellulars Log weight, g Length, cm Intra-species Inter-species (Daphnia pulex)
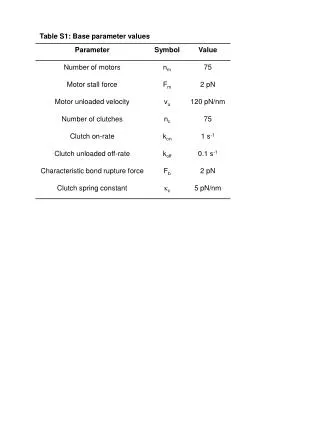
Initial reserve of an egg • Follows from: • maturity at birth equals a given value • reserve density at birth equals that of mother • State variables: • Parameters: • Problem: Given parameter values, find Theory in Kooy2008
Effects of nutrition scaled length at birth scaled age at birth scaled res density at birth scaled res density at birth scaled initial reserve scaled res density at birth
Reduction of initial reserve scaled maturity 1 scaled reserve 0.8 0.5 scaled age scaled age scaled struct volume scaled age
Scaling relationships log scaled initial reserve log scaled age at birth log zoom factor, z log zoom factor, z approximate slope at large zoom factor log scaled length at birth log zoom factor, z
Incubation time: intra-species Eudyptes first lays a small egg, then a large one, which hatches earlier if fertile It can rise one chick only If all parameters are the same, maturity at birth is reached earlier with big initial reserve
Incubation time: inter-species European birds tube noses 10log incubation time, d 10log incubation time, d slope = 0.25 lb equal ° tube noses 10log egg weight, g 10log egg weight, g Data from Harrison 1975
Gestation time 8.2.2l Mammals * Insectivora + Primates Edentata Lagomorpha Rodentia Carnivora Proboscidea Hyracoidea Perissodactyla Artiodactyla slope = 0.33 10log gestation time, d 10log adult weight, g Data from Millar 1981 Kooijman 1986 J Theor Biol 121: 269-282
Lp, cm L, cm Length at puberty Clupoid fishes Clupea • Brevoortia ° Sprattus Sardinops Sardina Sardinella + Engraulis * Centengraulis Stolephorus Data from Blaxter & Hunter 1982 Length at first reproduction Lp ultimate lengthL
Feeding rate slope = 1 Filtration rate, l/h Mytilus edulis Data: Winter 1973 poikilothermic tetrapods Data: Farlow 1976 Length, cm
Von Bertalanffy growth rate 25 °C TA = 7 kK 10log von Bert growth rate, a-1 10log ultimate length, mm 10log ultimate length, mm At 25 °C : maint rate coeff kM = 400 a-1 energy conductance v = 0.3 m a-1 ↑ 0
Costs for movement 8.2.2m Movement costs per distance V2/3 Investment in movement V included in somatic maintenance Home range V1/3 Data: Fedak & Seeherman , 1979 Data: Beamish, 1978 slope = -1/3 slope = -1/3 Walking costs: 5.39 ml O2 cm-2 km-1 Swimming costs: 0.65 ml O2 cm-2 km-1
Ageing among species 8.2.2n Right whale slope 1/3, 1/5 Ricklefs & Finch 1995 • Conclusion for life span • hardly depends on max body size of ectotherms • increases with length in endotherms
Abundance 8.2.3 Data: Peters, 1983 feeding rate V food production constant Abundance V-1 Kooijman 1986 J Theor Biol 121: 269-282
DEB tele course 2013 http://www.bio.vu.nl/thb/deb/ Free of financial costs; Some 108 or 216 h effort investment Program for 2013: Feb/Mar general theory (5w) April symposium at NIOZ-Texel (NL) (8d +3 d) Target audience: PhD students We encourage participation in groups who organize local meetings weekly Software package DEBtool for Octave/ Matlab freely downloadable Slides of this presentation are downloadable from http://www.bio.vu.nl/thb/users/bas/lectures/ Cambridge Univ Press 2009 Audience: thank you for your attention