Download

1 / 30
300 likes | 455 Views
Sketching as a Tool for Numerical Linear Algebra. David Woodruff IBM Almaden. Massive data sets. Examples Internet traffic logs Financial data etc. Algorithms Want nearly linear time or less Usually at the cost of a randomized approximation. Regression analysis. Regression

E N D
Sketching as a Tool for Numerical Linear Algebra David Woodruff IBM Almaden
Massive data sets Examples Internet traffic logs Financial data etc. Algorithms Want nearly linear time or less Usually at the cost of a randomized approximation
Regression analysis Regression Statistical method to study dependencies between variables in the presence of noise.
Regression analysis Linear Regression Statistical method to study linear dependencies between variables in the presence of noise.
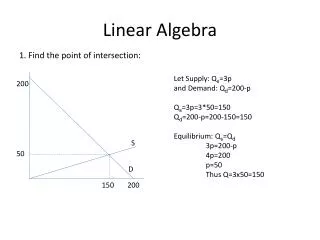
Regression analysis Linear Regression Statistical method to study linear dependencies between variables in the presence of noise. Example Ohm's law V = R ∙ I
Regression analysis Linear Regression Statistical method to study linear dependencies between variables in the presence of noise. Example Ohm's law V = R ∙ I Find linear function that best fits the data
Regression analysis Linear Regression Statistical method to study linear dependencies between variables in the presence of noise. Standard Setting One measured variable b A set of predictor variables a ,…, a Assumption: b = x + a x + … + a x + e e is assumed to be noise and the xi are model parameters we want to learn Can assume x0 = 0 Now consider n observations of b 1 d 1 1 0 d d
Regression analysis Matrix form Input: nd-matrix A and a vector b=(b1,…, bn)n is the number of observations; d is the number of predictor variables Output: x* so that Ax* and b are close Consider the over-constrained case, when n À d Can assume that A has full column rank
Regression analysis Least Squares Method Find x* that minimizes |Ax-b|22 = S (bi – <Ai*, x>)² Ai* is i-th row of A Certain desirable statistical properties Method of least absolute deviation (l1 -regression) Find x* that minimizes |Ax-b|1 = S |bi – <Ai*, x>| Cost is less sensitive to outliers than least squares
Regression analysis Geometry of regression We want to find an x that minimizes |Ax-b|p The product Ax can be written as A*1x1 + A*2x2 + ... + A*dxd where A*i is the i-th column of A This is a linear d-dimensional subspace The problem is equivalent to computing the point of the column space of A nearest to b in lp-norm
Regression analysis Solving least squares regression via the normal equations How to find the solution x to minx |Ax-b|2 ? Normal Equations: ATAx = ATb x = (ATA)-1 AT b
Regression analysis Solving l1 -regression via linear programming Minimize (1,…,1) ∙ (a + a ) Subject to: A x + a - a = b a , a ≥ 0 Generic linear programming gives poly(nd) time + - + - - +
Talk Outline • Sketching to speed up Least Squares Regression • Sketching to speed up Least Absolute Deviation (l1) Regression • Sketching to speed up Low Rank Approximation
Sketching to solve least squares regression • How to find an approximate solution x to minx |Ax-b|2 ? • Goal: output x‘ for which |Ax‘-b|2· (1+ε) minx |Ax-b|2 with high probability • Draw S from a k x n random family of matrices, for a value k << n • Compute S*A and S*b • Output the solution x‘ to minx‘ |(SA)x-(Sb)|2
How to choose the right sketching matrix S? • Recall: output the solution x‘ to minx‘ |(SA)x-(Sb)|2 • Lots of matrices work • S is d/ε2 x n matrix of i.i.d. Normal random variables • Computing S*A may be slow…
How to choose the right sketching matrix S? [S] • S is a Johnson Lindenstrauss Transform • S = P*H*D • D is a diagonal matrix with +1, -1 on diagonals • H is the Hadamard transform • P just chooses a random (small) subset of rows of H*D • S*A can be computed much faster
Even faster sketching matrices [CW,MM,NN] Surprisingly, this works! [ [ 0 0 1 0 0 1 0 0 1 0 0 0 0 0 0 0 0 0 0 -1 1 0 -1 0 0-1 0 0 0 0 0 1 • CountSketch matrix • Define k x n matrix S, for k = d2/ε2 • S is really sparse: single randomly chosen non-zero entry per column
Talk Outline • Sketching to speed up Least Squares Regression • Sketching to speed up Least Absolute Deviation (l1) Regression • Sketching to speed up Low Rank Approximation
Sketching to solve l1-regression • How to find an approximate solution x to minx |Ax-b|1 ? • Goal: output x‘ for which |Ax‘-b|1· (1+ε) minx |Ax-b|1 with high probability • Natural attempt: Draw S from a k x n random family of matrices, for a value k << n • Compute S*A and S*b • Output the solution x‘ to minx‘ |(SA)x-(Sb)|1 • Turns out this does not work!
Sketching to solve l1-regression [SW] • Why doesn’t outputting the solution x‘ to minx‘ |(SA)x-(Sb)|1 work? • Don‘t know of k x n matrices S with small k for which if x‘ is solution to minx |(SA)x-(Sb)|1 then |Ax‘-b|1 · (1+ε) minx |Ax-b|1 with high probability • Instead: can find an S so that |Ax‘-b|1 · (d log d) minx |Ax-b|1 • S is a matrix of i.i.d. Cauchy random variables
Cauchy random variables • Cauchy random variables not as nice as Normal (Gaussian) random variables • They don’t have a mean and have infinite variance • Ratio of two independent Normal random variables is Cauchy
Sketching to solve l1-regression • How to find an approximate solution x to minx |Ax-b|1 ? • Want x‘ for which if x‘ is solution to minx |(SA)x-(Sb)|1 , then |Ax‘-b|1· (1+ε) minx |Ax-b|1 with high probability • For d log d x n matrix S of Cauchy random variables: |Ax‘-b|1 · (d log d) minx |Ax-b|1 • For this “poor” solution x’, let b’ = Ax’-b • Might as well solve regression problem with A and b’
Sketching to solve l1-regression • Main Idea: Compute a QR-factorization of S*A • Q has orthonormal columns and Q*R = S*A • A*R-1 turns out to be a “well-conditioning” of original matrix A • Compute A*R-1 and sample d3.5/ε2 rows of [A*R-1 , b’] where the i-th row is sampled proportional to its 1-norm • Solve regression problem on the (reweighted) samples
Sketching to solve l1-regression [MM] [ [ [ [ C1 C2 C3 … Cn 0 0 1 0 0 1 0 0 1 0 0 0 0 0 0 0 0 0 0 -1 1 0 -1 0 0-1 0 0 0 0 0 1 ¢ • Most expensive operation is computing S*A where S is the matrix of i.i.d. Cauchy random variables • All other operations are in the “smaller space” • Can speed this up by choosing S as follows:
Further sketching improvements [WZ] [ [ [ [ 1/E1 1/E2 1/E3 … 1/En 0 0 1 0 0 1 0 0 1 0 0 0 0 0 0 0 0 0 0 -1 1 0 -1 0 0-1 0 0 0 0 0 1 ¢ • Can show you need a fewer number of sampled rows in later steps if instead choose S as follows • Instead of diagonal of Cauchy random variables, choose diagonal of reciprocals of exponential random variables
Talk Outline • Sketching to speed up Least Squares Regression • Sketching to speed up Least Absolute Deviation (l1) Regression • Sketching to speed up Low Rank Approximation
Low rank approximation • A is an n x n matrix • Typically well-approximated by low rank matrix • E.g., only high rank because of noise • Want to output a rank k matrix A’, so that |A-A’|F· (1+ε) |A-Ak|F, w.h.p., where Ak = argminrank k matrices B |A-B|F • For matrix C, |C|F = (Σi,j Ci,j2)1/2
Most time-consuming step is computing S*A Solution to low-rank approximation [S] • Given n x n input matrix A • Compute S*A using a sketching matrix S with k << n rows. S*A takes random linear combinations of rows of A • S can be matrix of i.i.d. Normals • S can be a Fast Johnson Lindenstrauss Matrix • S can be a CountSketch matrix A SA • Project rows of A onto SA, then find best rank-k approximation to points inside of SA.
Caveat: projecting the points onto SA is slow [CW] • Current algorithm: • Compute S*A (easy) • Project each of the rows onto S*A • Find best rank-k approximation of projected points inside of rowspace of S*A (easy) • Bottleneck is step 2 • Turns out if you compute (AR)(S*A*R)-(SA), this is a good low-rank approximation • Uses generalized regression: minX |X(SA)-A|F2
Conclusion • Gave fast sketching-based algorithms for numerical linear algebra problems • Least Squares Regression • Least Absolute Deviation (l1) Regression • Low Rank Approximation • Sketching also provides “dimensionality reduction” • Communication-efficient solutions for these problems