Download
1 / 130
1.6k likes | 2.31k Views
Pericardial Disease. Susan A. Raaymakers , MPAS, PA-C, RDCS (AE)(PE) Radiologic and Imaging Sciences - Echocardiography Grand Valley State University, Grand Rapids, Michigan raaymasu@gvsu.edu. Normal Pericardium For ARDMS Exam. Three layers: Fibrous pericardium – thick outer sack

E N D
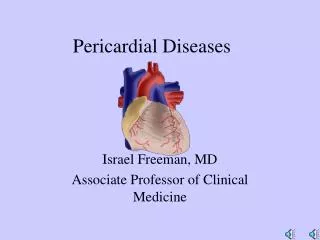
Pericardial Disease Susan A. Raaymakers, MPAS, PA-C, RDCS (AE)(PE) Radiologic and Imaging Sciences - Echocardiography Grand Valley State University, Grand Rapids, Michigan raaymasu@gvsu.edu
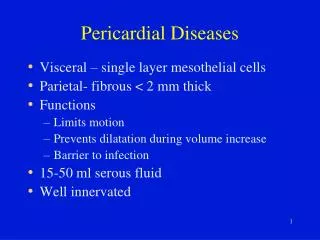
Normal PericardiumFor ARDMS Exam • Three layers: • Fibrous pericardium – thick outer sack • Serous parietal – bound to fibrous pericardium smooth, ‘the wall of a cavity’ • Serous visceral – bound to epicardium smooth, ‘toward the organ’ • 5 to 10 ml pericardial fluid found in between the two serous layers
Normal Pericardium • Pericardial fluid is often appreciated as a very small echo-free space in the posterior atrioventricular groove. • Echo-free space between visceral and parietal pericardium (epicardium and fibrous pericardium) • Visualized as a small anechoic space in the posterior AV groove that may be visible only in systole 09-001a-1b Feigenbaum
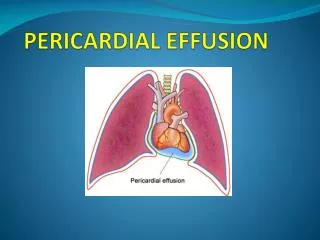
Pericardial Diseases • Can present as several different clinical scenarios • Pericardial effusions can accumulate in any infectious or inflammatory process involving the pericardium • Most infectious and inflammatory process involve both layers of the pericardium (visceral and parietal)
Pericardial Diseases • Pericardial space is limited • Accumulation of significant pericardial fluid reduces the space that the heart may occupy Non-dynamic
Pericardial Diseases • Hemodynamic compromise is related to intrapericardial pressure • Intrapericardial pressure is related to the volume of pericardial fluid and the COMPLIANCE OR DISTENSIBILITY of the pericardium
Pericardial Diseases • Slowly developing large effusions are better tolerated than a smaller but more rapidly developing effusion • More rapidly developing effusion does not allow the heart to compromise 09-004a Feigenbaum
Difference in pericardial pressures - Rapid vs slow accumulation ACUTE CHRONIC PRESSURE VOLUME
Detection and Quantification of Pericardial Fluid M-Mode • Appears as anechoic space both anterior and posterior to the heart. • Note: An isolated anterior free space is not specific for pericardial fluid. • Isolated anterior anechoic space may be due to mediastinal fat
Detection and Quantification of Pericardial Fluid M-Mode • Size of anechoic space is directly proportional to the amount of fluid • No accurate M-mode techniques for quantifying absolute volume of pericardial fluid
Detection and Quantification of Pericardial Fluid 2D • Most often used for screening • Seen between Descending Ao and CS • Most echocardiographic labs visually quantify pericardial effusion as: • Minimal • Small • Moderate • Large • Further characterize: • Either free or loculated • Presence or absence of hemodynamic compromise
Detection and Quantification of Pericardial Fluid Small Pericardial Effusion- 1 cm of posterior anechoic space with or w/out fluid accumulation elsewhere 09-003 Feigenbaum Minimal Pericardial Fluid - Normal 09-001a-1b Feigenbaum
Detection and Quantification of Pericardial Fluid Large Pericardial Effusion – more than 2 cm of maximal separation 09-004b Feigenbaum Moderate Pericardial Effusion – 1 to 2 cm of anechoic space 09-004a Feigenbaum
Minimal Pericardial Fluid Small Pericardial Effusion Large Pericardial Effusion Moderate Pericardial Effusion
Large pericardial effusion: signs • Soft heart sounds • Reduced intensity of friction rub • Ewart’s sign: Dullness and decreased breath sounds, over posterior L lung due to compression by large pericardial sac • Electrical alternans on ECG
Large pericardial effusion: signs • Electrical alternans on ECG
Large Pericardial Effusion and a Swinging Heart • Large pericardial effusion • In this image also a large pleural effusion 09-010a-10b Feigenbaum
Detection and Quantification of Pericardial Fluid • On 2D echo: pericardial effusion typically appears maximal in the posterior atrioventricular groove • Use multiple views to reliably assess fluid including PSAX, Apicals, and Subcostals 09-004a Feigenbaum
Detection and Quantification of Pericardial Fluid Small Pericardial Effusion – PSAX PM Large Pericardial Effusion – PSAX PM 09-007 Feigenbaum 09-006 Feigenbaum
Detection and Quantification of Pericardial Fluid Moderate, predominately lateral pericardial effusion (PEF) Note PEF behind RA Mod to Large PEF w/greatest dimension lateral to LV free wall 09-009 Feigenbaum 09-008 Feigenbaum
Detection and Quantification of Pericardial Fluid • PEF may be localized or loculated rather than circumferential • May occur after cardiac surgery or cardiac trauma Non-dynamic
Loculated effusion at apex Non-dynamic
Stranding and Fluid Accumulation • Presence of fluid accumulation, masses and stranding • Occur either on the visceral pericardium or the interior aspect of the parietal pericardium • Fibrin strands are commonly seen in long-standing effusions or effusions from metastatic diseases 09-016 Feigenbaum
Direct Visualization of the Pericardium 09-017 Feigenbaum
Detection and Quantification of Pericardial Fluid • Several schemes have been used for actual quantification of pericardial volume • None have had universal clinical acceptance • 3D echo may provide the most accurate technique for quantification and assessment • 3D volume of entire pericardial space is calculated • Overall total volume of the entire heart is calculated • Pericardial fluid is calculated as the difference between entire pericardial space and overall total volume • Little significance due to lack of 3D availability and lack of clinical need to determining precise pericardial volume
Detection and Quantification of Pericardial Fluid • 3D Pericardial Effusion 09-013b Feigenbaum
Direct Visualization of the Pericardium • Pleural effusion creates a fluid layer on either side of the pericardium • In absence of pleural effusion exterior potion of parietal pericardium abuts the normal intrathoracic structures • Therefore, thickness and character of the pericardium cannot be separated from the surrounding tissues • When both pericardial and pleural effusions are present, thickness of pericardium in hat area can be assessed
Direct Visualization of the Pericardium 09-010a-10b Feigenbaum
Direct Visualization of the Pericardium • Presence of calcific pericarditis may be marked shadowing seen posterior to pericardium • Normal pericardium is highly reflective • Hyperechoic pericardium alone should not be used to diagnose constrictive pericarditis 09-015 Feigenbaum
Differentiation of Pericardial from Pleural Effusion • Pleural effusion can be mistaken for pericardial effusion • Fluid appearing exclusively behind the LA is more likely to represent pleural than pericardial effusion • Pericardial reflections surround the pulmonary veins and tend to limit the potential space behind the LA
Differentiation of Pericardial from Pleural Effusion • Location of fluid-space with respect to descending thoracic aorta • Pericardial reflection is typically anterior to the descending aorta • Fluid appearing posterior to descending aorta more likely pleural Non-dynamic
Hierarchy of Hemodynamically Significant Pericardial Effusions • Exaggerated respiratory variation of tricuspid inflow • Exaggeration in mitral inflow • Right atrial collapse occurs at lower levels of intrapericardial pressure elevations than RVOT collapse • Right ventricular free wall collapse (may be seen in expiration but not inspiration with RV filling is increased) • When intrapericardial pressure is elevated and consistently exceeds intravascular pressures the above findings will be present simultaneously
Hierarchy of Hemodynamically Significant Pericardial Effusions Instances with changes may not be seen: • Significant RVH usually d/t pulmonary hypertension • Thick, noncompliant RV wall is not compressed by modest elevation in pericardial pressure • Thickening of the ventricular wall d/t malignancy, an overlying inflammatory respoinse or an overlying thrombus in a hemhorrhagic pericarditis • Hypovolumia causing a low pressure tamponade
Cardiac Tamponade • Clinical diagnosis made at the bedside; • Echo helps determine the amount and location of fluid • Occurs mostly with moderate-to-large effusions although small, rapidly accumulated effusions may also cause tamponade
Cardiac TamponadeClinical Features • Symptoms • dyspnea, fatigue, cough, agitation and restlessness, syncope, and shock • Physical examination • pulsusparadoxus (may also be present in COPD patients or patients on ventilators) • ECG may shows electrical alternans • increased jugular venous pressure • Beck’s triad • Elevated venous pressure • Hypotension • Quiet heart
Respiration Variation Review: • Inspiration: intrathoracic and intrapericardial pressures ↓ • ↑flow into right heart • ↑right ventricular filling and stroke volume • ↓ flow to pulmonary veins • Compensatory decrease in left ventricular stroke volume in early inspiration
Respiration Variation Review: • Expiration: • Intrathoracic pressure and intrapericardial pressure ↑ • Mild ↓ in RV diastolic filling • ↑ in LV filling
Respiration Variation • Cyclic variation of LV and RV filling is sufficient to create mild changes in stroke volume (SV) and blood pressure • Normal respiratory variation of SV results in ≤ 10 mmHg ↓ in systolic arterial systolic pressure with inspiration • Processes that alter the respiratory cycle (i.e. COPD) ↑ work of breathing ↑intrathoracic pressure swings • Alter variation of SV and arterial pulse pressure
Cardiac Tamponade • ↑ accumulation of pericardial fluid ↑ intrapericardial pressure and affects RV filling • Overall effect of ↑volume of pericardial fluid limits total blood volume within four cardiac chambers • Exaggerate the respiration-dependent ventricular volume • If intrapericardial pressure >normal filling pressure, filling is determined by intrapericardial pressure
Cardiac Tamponade • LV has stiffer wall and diastolic filling is determined largely by active relaxation LV filling is relatively unaffected compared to RV filling • In large pericardial effusions, elevation of interpericardial pressure inspiration results in disproportionately greater filling of RV than normal and leads to greater compromise of LV filling
Pericardial Tamponade:Pathophysiology • Increased intra-pericardial pressure • Exceeds ventricular diastolic pressure • Causing impaired diastolic filling • Elevated venous pressure • JVP, hepatomegaly, edema • Dyspnea • Decreased filling decreased stroke volume • Reflex tachycardia, hypotension
Cardiac Tamponade • Marked exaggeration in phasic changes with respiration • Greater decrease in systolic arterial blood pressure with inspiration • Variation of BP with respiration called pulses paradoxus
Cardiac Tamponade- Doppler Findings • Under normal circumstances, peak velocity of mitral inflow varies by 15% with respiration and tricuspid by 25% • Variation of aortic and pulmonary flow velocities vary less than 10%
Cardiac Tamponade- Doppler Findings Tricuspid • In presence of hemodynamically significant pericardial effusion: • Respiratory variation is exaggerated above normal variation and therefore velocities are exaggerated • Inspiration: ↑right↓left • Expiration: ↓right ↑left Mitral