Download
1 / 12
120 likes | 207 Views
SOLAR INTENSITY VARIABILITY AND CROP SPECTRAL REFLECTANCE. By Birehane Desta Thanks to Y.Kanke, Y. Mohammed, E. Ruto, and D. Edmonds. INTRODUCTION. The sun is the source of light intensity for passive sensors.

E N D
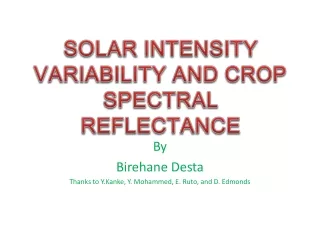
SOLAR INTENSITY VARIABILITY AND CROP SPECTRAL REFLECTANCE By Birehane Desta Thanks to Y.Kanke, Y. Mohammed, E. Ruto, and D. Edmonds
INTRODUCTION • The sun is the source of light intensity for passive sensors. • This intensity is not always reliable and constant for crop measurement even during the overhead sun. • Intensity may vary(fluctuate) during; measuring two nearby plots, at different hours ,and seasons.
Sun Atmosphere Hydrosphere Lithospher Biosphere Adopted from Robert Derveloy's photostream • Cloud, landscapes, and trees are the main cause for variability of incoming radiation.
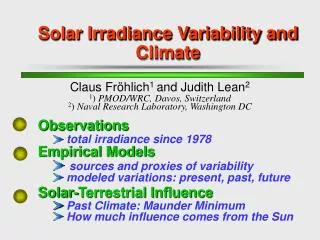
OBJECTIVE • The objective of this presentation is to show the effect of Solar intensity variation on winter wheat spectral reflectance
MATERIALS AND METHODS • Spectral measurements were taken on high and low intensity days from different treatments of winter wheat(Perkins,OK) using Ocean Optics Spec 4000. • Based on the intensity variation within time ,white board measurements were taken untill the end of the reading. • The intensity were compared and the differences were considered. • Then reflectance was computed.
Using SAS, minimum and maximum reading were selected both from low and high intensity days and NDVI was computed. • Correlation analysis was employed for low and high intensity NDVI to evaluate the degree of determination (R2). • For some selected wave lengths, the high and the low intensity trend were compared.
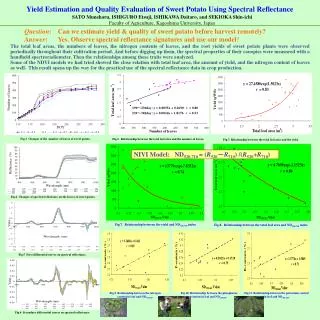
R2 value from low and high reflectance NDVI RESULTS • There were no R2=1 for the NDVI from the same spot-measured at different solar intensity.
The correlation between low and high intensity- reflectance NDVI of each plot were not significant.
Plots in treatment and rep order, and reflectance trend, Perkins 2009. Low intensity-reflectance (505,LI R min), (865,LI NIR max) and High Intensity-(505,HI R min),(865,HI NIR max) were almost had similar reflectance
Reflectance variation is higher for low intensity than high intensity. • High intensity variation was found with in an hour time measurements on high isolation day.
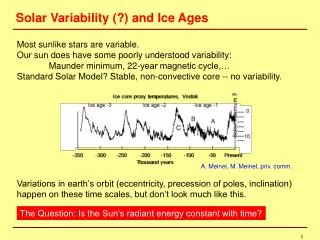
Temporal fluctuation of solar intensity resulted in biased winter wheat crop reflectance measurement when passive sensors were used.