Download
1 / 16
230 likes | 379 Views
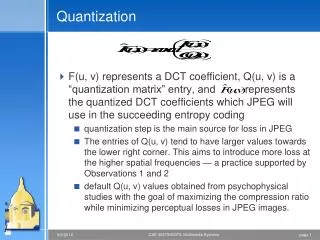
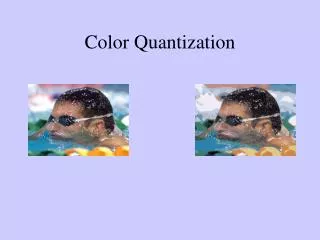
Quantization. Foveation grid: point of focus in the middle. Resolution. Human eyes Sample received light on 2-D grid Photoreceptor density in retina falls off exponentially away from fovea (point of focus) Respond logarithmically to intensity (amplitude) of light Human ears

E N D
Foveation grid: point of focus in the middle Resolution • Human eyes Sample received light on 2-D grid Photoreceptor density in retinafalls off exponentially awayfrom fovea (point of focus) Respond logarithmically tointensity (amplitude) of light • Human ears Respond to frequencies in 20 Hz to 20 kHz range Respond logarithmically in both intensity (amplitude) of sound (pressure waves) and frequency (octaves) Log-log plot for hearing response vs. frequency
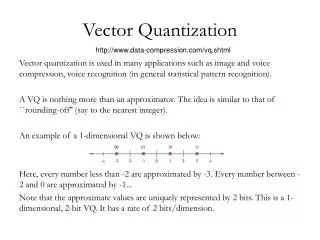
Types of Quantizers • Quantization is an interpretation of a continuous quantity by a finite set of discrete values • Amplitude quantization approximates its input by a discrete amplitude taken from finite set of values For the sampler, stay in continuous time domain at input and output to decide on time invariance
y 1 1 m law A law x x 1 1 Public Switched Telephone Network • Sample voice signals at 8000 samples/s • Quantize voice to 8 bits/sample Uniformly quantize to 8 bits/sample, or Compand by uniformly quantizing to 12 bits and map12 bits logarithmically to 8 bits (by lookup table) to allocate more bits in quiet segments (where ear is more sensitive) Maximum data rate? kbps m = 256 in US/Japan and A = 87.6 in Europe
Q[x] 1 x -2 1 -2 Uniform Quantization • Round to nearest integer (midtread) Quantize amplitude to levels {-2, -1, 0, 1} Step size D for linear region of operation Represent levels by {00, 01, 10, 11} or{10, 11, 00, 01} … Latter is two's complement representation • Rounding with offset (midrise) Quantize to levels {-3/2, -1/2, 1/2, 3/2} Represent levels by {11, 10, 00, 01} … Step size Q[x] 1 x Used in slide 8-10 -2 1 2 -1
Handling Overflow • Example: Consider set of integers {-2, -1, 0, 1} Represented in two's complement system {10, 11, 00, 01}. Add (–1) + (–1) + (–1) + 1 + 1 Intermediate computations are – 2, 1, –2, –1 for wraparound arithmetic and –2, –2, –1, 0 for saturation arithmetic • Saturation: When to use it? If input value greater than maximum,set it to maximum; if less than minimum, set it to minimum Used in quantizers, filtering, other signal processing operators • Wraparound: When to use it? Addition performed modulo set of integers Used in address calculations, array indexing Native support in MMX and DSPs Standard two’s complement behavior
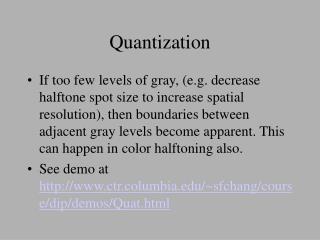
Audio Compact Discs (CDs) • Sampled at 44.1 kHz Analog signal bandwidth of 20 kHz Analog bandwidth from 20 kHz to 22.05 kHz is for anti-aliasing filter to rolloff from passband to stopband (10% of maximum passband frequency) • Amplitude is uniformly quantized to B = 16 bits to yield dynamic range (signal-to-noise ratio) of 1.76 dB + 6.02 dB/bit * B = 98.08 dB This loose upper bound is derived later in slides 8-11 to 8-15 In practice, audio CDs have dynamic range of about 95 dB • Dynamic range helps set filter design specifications
Dynamic Range in Audio • Sound Pressure Level (SPL) Reference in dB SPL is 20 Pa (threshold of hearing) Typical living room has 40 dB SPL of noise Sound intensity of 120 dB SPL is threshold of pain Dynamic range is 80 dB SPL, which audio CDs far exceed • In linear systems, SNR = dynamic range • Find maximum RMS output of the system with some specified amount of distortion, typically 1% • Find RMS output of system with small input signal (e.g.-60 dB of full scale) with input signal removed from output • Divide (b) into (a) to find the dynamic range Contribution by Dr. Thomas D. Kite, Audio Precision
Digital vs. Analog Audio • An audio engineer claims to notice differences between analog vinyl master recording and the remixed CD version. Is this possible? When digitizing an analog recording, the maximum voltage level for the quantizer is the maximum volume in the track Samples are uniformly quantized (to 216 levels in this case although early CDs circa 1982 were recorded at 14 bits) Problem on a track with both loud and quiet portions, which occurs often in classical pieces When track is quiet, relative error in quantizing samples grows Contrast this with analog media such as vinyl which responds linearly to quiet portions
Digital vs. Analog Audio • Analog and digital media response to voltage v • For a large dynamic range Analog media: records voltages above V0 with distortion Digital media: clips voltages above V0 to V0 • Audio CDs use delta-sigma modulation Effective dynamic range of 19 bits over lower frequencies but lower than 16 bits for higher frequencies Human hearing is more sensitive at lower frequencies
Quantization output Input signal plus noise Noise is difference of output and input signals Signal-to-noise ratio (SNR) derivation Quantize to B bits Quantization error Assumptions m (-mmax, mmax) Uniform midrise quantizer Input does not overload quantizer Quantization error (noise) is uniformly distributed Number of quantization levels L = 2B is large enoughso that QB[ · ] m v Quantization Error (Noise) Analysis
Deterministic signal x(t) w/Fourier transformX(f) Power spectrum is square of absolute value of magnitude response (phase is ignored) Multiplication in Fourier domain is convolution in time domain Conjugation in Fourier domain is reversal and conjugation in time Autocorrelation ofx(t) Maximum value at Rx(0) Rx(t) is even symmetric, i.e. Rx(t) = Rx(-t) x(t) 1 0 Ts t Rx(t) Ts -Ts Ts t Quantization Error (Noise) Analysis
Quantization Error (Noise) Analysis • Power spectrum for signalx(t) is • Autocorrelation of random signal n(t) • For zero-mean Gaussiann(t)with variances2 • Estimate noise powerspectrum in Matlab noise floor N = 16384; % number of samplesgaussianNoise = randn(N,1);plot( abs(fft(gaussianNoise)) .^ 2 );
Quantizer step size Quantization error q is sample of zero-mean random process Q q is uniformly distributed Input power: Paverage,m SNR exponential in B Adding 1 bit increases SNR by factor of 4 Derivation of SNR in deciBels on next slide Quantization Error (Noise) Analysis
Quantization Error (Noise) Analysis • SNR in dB = constant + 6.02 dB/bit * B • What is maximum number of bits of resolution for Landline telephone speech signal of SNR of 35 dB Audio CD signal with SNR of 95 dB Loose upper bound 1.76 and 1.17 are common constants used in audio
Noise Immunity at Receiver Output • Depends on modulation, average transmit power, transmission bandwidth, channel noise, demod • Analog communications (receiver output SNR) “When the carrier to noise ratio is high, an increase in the transmission bandwidth BT provides a corresponding quadratic increase in the output signal-to-noise ratio or figure of merit of the [wideband] FM system.”– Simon Haykin, Communication Systems, 4th ed., p. 147. • Digital communications (receiver symbol error) For code division multiple access (CDMA) spread spectrum communications, probability of symbol error decreases exponentially with transmission bandwidth BT– Andrew Viterbi, CDMA: Principles of Spread SpectrumCommunications, 1995, pp. 34-36.