Download
1 / 8
90 likes | 134 Views
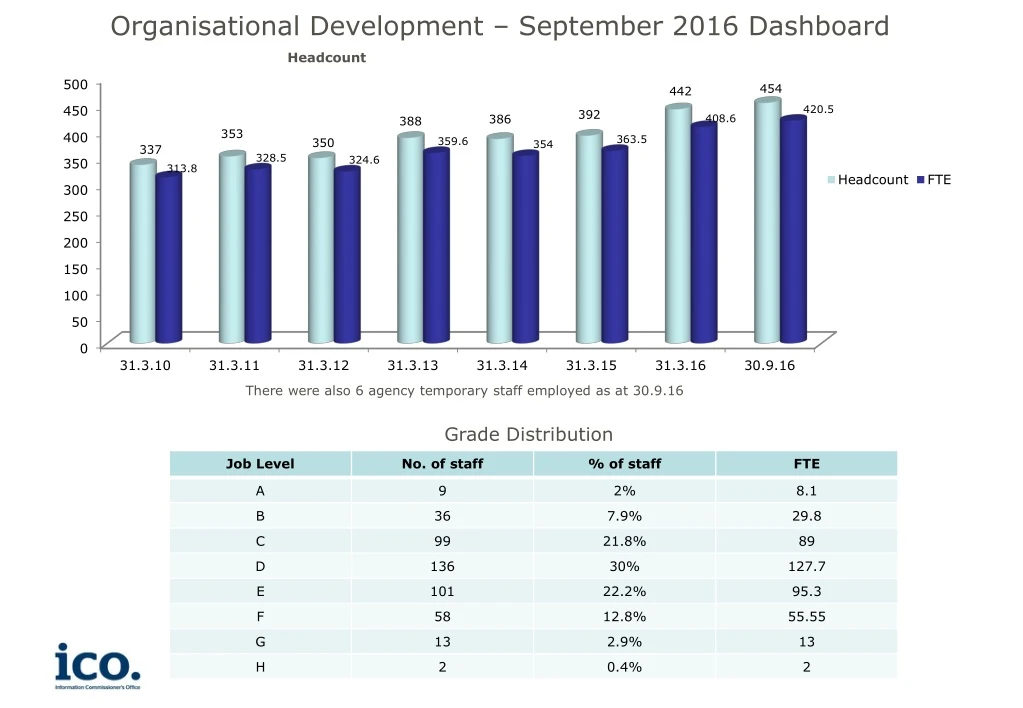
Organisational Development – September 2016 Dashboard. Headcount. There were also 6 agency temporary staff employed as at 30.9.16. Grade Distribution. Headcount by department. As at 30 September 2016. For comparison at 30 September 2014. Commentary

E N D
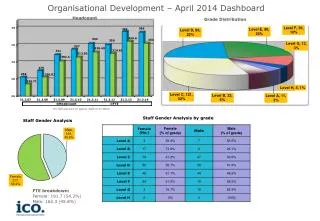
Organisational Development – September 2016 Dashboard Headcount There were also 6 agency temporary staff employed as at 30.9.16 Grade Distribution
Headcount by department As at 30 September 2016 For comparison at 30 September 2014 Commentary The figures provided for 2014 have been adjusted to provide comparisons between the figures. For example in 2014 there was an IT and Facilities department, but those staff have been placed in Customer and Business Services (IT) and Organisational Development (Facilities). FOI Appeals Lawyers are counted in the Policy Delivery figures in 2014, but are currently counted within the Performance Improvement figures. The most growth has been in the area of Enforcement and Performance Improvement. Some of the growth for Performance Improvement can be attributed to the move of a Customer Contact Team into the department as well as the FOI Appeals Lawyers.
Equality and Diversity Data Staff ethnicity analysis Staff disability analysis Age analysis
Staff turnover, Starters, Leavers and promotions Staff Turnover Staff turnover in the first half of the year was 4.2% which is consistent with the turnover rateafter the first half in recent years. At this rate the full year turn over would be 8.4% 19 staff have left the ICO from April 2016: This comprised 13 promotions/role changes outside the ICO, a retirement and 5 for personal reasons.