Download
1 / 31
310 likes | 319 Views
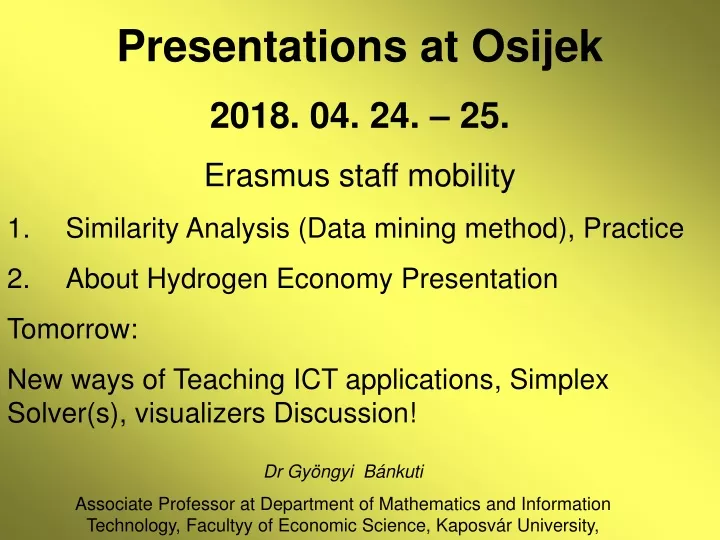
Presentations at Osijek 2018. 04. 24. – 25. Erasmus staff mobility Similarity Analysis (Data mining method), Practice About Hydrogen Economy Presentation Tomorrow: New ways of Teaching ICT applications , Simplex Solver(s), visualizers Discussion!. Dr Gyöngyi Bánkuti

E N D
Presentations at Osijek 2018. 04. 24. – 25. Erasmus staff mobility • Similarity Analysis (Data mining method), Practice • About Hydrogen Economy Presentation Tomorrow: New ways of Teaching ICT applications, Simplex Solver(s), visualizers Discussion! Dr Gyöngyi Bánkuti Associate Professor at Department of Mathematics and Information Technology, Facultyy of Economic Science, Kaposvár University,
Similarity Analysis Component-based Comparison for Objectivity COCO Dr Gyöngyi Bánkuti Associate Professor at Department of Mathematics and Information Technology, Facultyy of Economic Science, Kaposvár University, Dr László Pitlik Associate Professor at My-X research team, Szent István University,
Regression xy y b Xmax. x a = ? b = ?
A multivariate database m – number of attributes (columns) m Independent variables: Dependent variable: n – number of records (rows) n ? Vector form:
c(m-1) c1 c2 cm Xm-1 x1 x2 xm X(m-1)max. X1max. X2max. Xm max. yx (m-1) yxm yx2 yx1 Xm-1 x1 x2 xm X(m-1)max. Xm max. X1max. X2max. Interpretation of Multivariate Regression yxi - Partial estimating functions ci - constanses … …
yx (m-1) yxm yx2=c2.x2 yx1=c1.x1 Xm-1 xm x1 x2 X2max. Xm max. X1max. X(m-1)max. Interpretation of Multivariate Regression … = Addition of the directly, inverserly proportional parts ⇒ cj = ✔ = s0 + s1+ s2+ …. + sm-1+ sm
Idea of Additionality Our thinking, (the word) is rarely multiplicative. Mostly we valuate the things as sum of it’s properties. They contain percentages of utility, practicality, beauty, … It is given by the percentage of the property in the aggregation, that forms the estimation for example in regression. László Pitlik
Let’s be ci(xi) not constant, but spiecewise function! y „Segmented regression” c2 c3(-) c5 c1 c4 x
Ranges in segmented regression y • The ranges: [ tk - tk+1 ] • Might come from the real life • Should calculated from some constrain / -> system of equations (See literature) ti =? „Segmented regression” c2 c3(-) c5 c1 c4 x t1 tr t2 t3
c2 x2 xm yxm Interpretation of Multivariate segmented regression every ci is spiecewise function yxi - partial estimating functions c1 cm-1 cm … x1 Xm-1 yx(m-1) yx2 yx1 s2 … sm sm-1 s1 xm x2 Xm-1 x1
Interpretation of Multivariate segmented regression ci – spiecewise, segmented regression yxi - partial estimating functions = s0 + s1+ s2+ …. + sm-1+ sm
Discretized multivariate segmented regression Natural discetization of cj is n. - cj (xi) t11 - t12 t12 - t13 t13 - t14 ……… t1r-1 - t1r t21 - t22 t22 - t23 t23 - t24 ……… t2r-1 - t2r tm1 - tm2 tm2 - tm3 tm3 - tm4 …… tmr-1 - tmr • The ranges: [ tk - tk+1 ] • Might come from the real life • Should calculated from some constrain / -> system of equations (See literature) xm
No s0 ! si contains the constant part (c0) x2 Let’s si itself to be step function! … … No ci(xj)*xj just si S1(x1) … Sm sm-1 s1 s2 xm x1 X 1 X m-1 X m X 2 Xm-1
Step function estimation of si ! Used to be si(xj)=ci * xj (multivariate segmented regression) s1 x1 X 1 Estimation with stepwise function New idea! Directly xi→ si No intermediate step, multiplication.
c4 c1 c3 c2 x4 x1 x3 x2 X 1 X 2 X 3 X 4 How step function estimation works in the matrix Instead of coefficients, step function type estimation ri – number of categories in ranking ri n (number of cases) s1 s3 s2 s4
c4 c1 c3 c2 x4 x1 x3 x2 X 1 X 2 X 3 X 4 How step function estimation works in the matrix Sum of First row in the estimation is not the sum of the first row of the S matrix, BUT… s1 s3 + + + s2 s4
Further idea: sorting! To sort the row data. All columns! Instead of xi will use their number (in the sorted order) So we can use VLOOKUP function to pick up the values Sorting can be directly and inversely proportional !! (Rarely a method can handle these cases- so easiliy!) How it will occur in the model? What kind of model we have??
A simple example Evaluation of Coffee brands (Survey average) Biggest first All directly proportional
Evaluation of Coffe brands M N =VLOOKUP(M3,$C$16:$G$23,D$24,0)
Evaluation of Coffe brands M N =VLOOKUP(N5,$C$16:$G$23,E$24,0) Σ
Setting Solver Parameters >= 0 Modifing cells Subject to Goal function
Setting of Solver 0 Modifing cells Subject to Goal function
Stepf of COCO in Excel • Steps: • To rank the independent row data, considering the proportionality. (A new table.) • To create (orbitrary) stepfunctions, for all attributes. To create the auxiliary table (s11-s21 ; s21-s31 ; … ). • To create the estimation table . „Picks up the values from the stepfunctions”. (VLOOKUP !) • To sum the estimations. (Additional word concept!) • Form delta ( = yi – Estimation of yi) • To calculate the Error (can be linear, least square). • To construct the LP model in Solver: • Goal function: Error • Modifing table = stepfunctions’ values • Constrains: the auxiliary table ≥ 0 • Start Solver! • Chech and interpret the result !
COCO online http://miau.gau.hu/myx-free/coco/beker_y0.php
Steps of COCO Online • Steps: • To rank the independent row data, considering the proportionality. (A new table.) • Copy – Paste it togather with the dependent column (if) • Optional: You might submit the names of the attributes and records • Run COCO Y0 Online • Chech and interpret the result !
Results Islamic bank problem v.s. CAMEL
Thank You for Your attention! Your turn comes…