Download
1 / 30
300 likes | 322 Views
Learn about the importance of marginal analysis in analyzing output, price, and profit. Understand how firms determine the optimal level of production and price to maximize their total profit.

E N D
CH7 : Output, Price, and Profit : The Importance of Marginal Analysis Asst. Prof. Dr. Serdar AYAN
Total Fixed Costs Average Fixed Costs = Quantity Total Variable Costs Average Variable Costs = Quantity SHORT-RUN PRODUCTION COSTS Fixed Costs Total Fixed Costs Variable Costs Total Variable Costs
Total Costs Average Total Cost = Quantity Change in Total Costs Marginal Cost = Change in Quantity SHORT-RUN PRODUCTION COSTS Total Cost = Total Fixed + Variable Costs Marginal Cost Total Variable Costs
SHORT-RUN PRODUCTION COSTS Summary of Definitions Total Fixed Costs =TFC Total Variable Costs =TVC Total Costs =TC Average Fixed Costs =AFC Average Variable Costs =AVC Average Total Costs =ATC Marginal Cost =MC
SHORT-RUN COSTS GRAPHICALLY TC TVC Costs (dollars) TFC Quantity
LONG-RUN PRODUCTION COSTS Unit Costs Output
LONG-RUN PRODUCTION COSTS The Long-run ATC just “envelopes” all of the short-run ATC curves Unit Costs Output
LONG-RUN PRODUCTION COSTS Unit Costs Long-run ATC Output
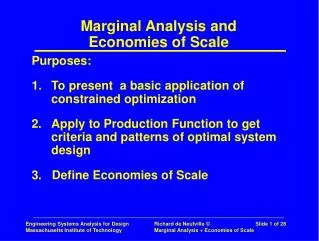
ECONOMIES AND DISECONOMIES OF SCALE Constant returns to scale Diseconomies of scale Economies of scale Unit Costs Long-run ATC Output
Price and Quantity: One Decision, Not Two • Firms face a demand curve on which price and quantity are related. • They can choose either price or quantity, but not both.
D a b c 26 d Profit maximum e 22 f g 19 h 16 i j D FIGURE 7-1 Demand Curve for Al’s Garages 35 30 25 20 Price per Garage (thousands $) 15 10 5 0 1 2 3 4 5 6 7 8 9 10 Output, Garages Marketed per Year .
Total Profit • Simplifying assumption: maximum total profit is the firm’s goal. • Total profit = total revenue - total costs
Total Profit • Total, Average, and Marginal Revenue • Total Revenue = P Q • Average Revenue = TR/Q = (P Q)/Q = P • Marginal Revenue = total revenue from one more unit of output = TR/Q. • Marginal Cost = total cost from one more unit of output = TC/Q.
H G I J F TR E D C B A FIGURE 7-2 Total Revenue Curve for Al’s Garages 140 120 100 80 60 Total Revenue per Year (thousands $) 40 20 0 1 2 3 4 5 6 7 8 9 10 Output, Garages Sold per Year
TC FIGURE 7-3 (a) Cost Curves for Al’s Garages 200 180 160 140 120 Total Cost per Year (thousands $) 100 80 60 40 20 0 1 2 3 4 5 6 7 8 9 10 Output, Garages per Year (a) Total Cost
FIGURE 7-3 (b) Cost Curves for Al’s Garages 45 40 35 30 25 Average Cost per Garage (thousands $) AC 20 15 10 5 0 1 2 3 4 5 6 7 8 9 10 Output, Garages per Year (b) Average Cost
MC FIGURE 7-3 (c) Cost Curves for Al’s Garages 50 45 40 35 30 Marginal Cost per Added Garage (thousands $) 25 20 15 10 5 0 1 2 3 4 5 6 7 8 9 10 Output, Garages per Year (c) Marginal Cost
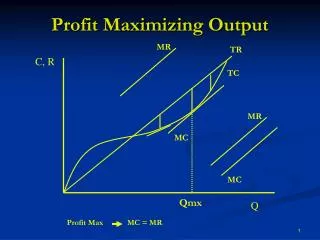
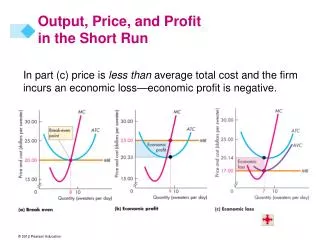
Total Profit • Maximization of Total Profits • Profits typically increase with output, then fall. • Some intermediate level of output, therefore, generates the maximum profit.
Marginal Analysis and Maximization of Total Profit • Marginal profit is the slope of the total profit curve. • Profit is at a maximum when the marginal profit is zero.
TC TR A Profit 96 74 22,000 B FIGURE 7-4 (a) Profit Maximization 200 180 160 140 120 Total Revenue, Total Cost per Year (thousands $) 100 80 60 40 20 0 1 2 3 4 5 6 7 8 9 10 Output, Garages per Year (a) Total Revenue. Total Cost
Total profit M 34 F E C D FIGURE 7-4 (b) Profit Maximization 40 20 0 9 2 3 4 5 6 7 8 10 1 Total Profit per Year (thousands $) –20 –40 –60 –80 Output, Garages per Year (b) Total Profit
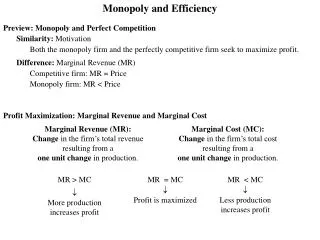
Marginal Analysis and Maximization of Total Profit • Optimum Marginal Revenue and Marginal Cost • If MR > MC, production profits • If MR < MC, production profits • Profit maximizing level out output: MR = MC
MC E MR Output, Garages per Year (a) Marginal Revenue and Marginal Cost FIGURE 7-5(a) Profit Maxim: Another Graphical Interpretation 50 40 30 MR and MC per Garage per Year (thousands $) 20 10 0 1 2 3 4 5 6 7 8 9 10 –10
Marginal Analysis and Maximization of Total Profit • Finding the Optimal Price from Optimal Output • MR = MC: rule for determining the level of output • Demand curve price buyers will pay to purchase that level of output • Both output and price are now determined for the profit maximizing firm.
Logic of Marginal Analysis & Maximization • Application: Fixed Cost and Profit Maximization • An increase in fixed costs does not change optimal output or price because it does not affect marginal costs.