Download
1 / 18
180 likes | 323 Views
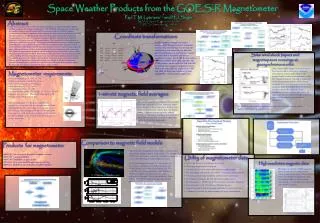
Characterizing the Attenuation and/or Saturation Effect of the Acoustic Scanner Noise In Auditory Event-Related Functional Magnetic Resonance Imaging. G. Tamer Jr. 1 , T.M. Talavage 1,2 , J.L. Ulmer 3 1 School of Electrical & Computer Engineering, Purdue University

E N D
Characterizing the Attenuation and/or Saturation Effect of the Acoustic Scanner Noise In Auditory Event-Related Functional Magnetic Resonance Imaging G. Tamer Jr.1, T.M. Talavage1,2, J.L. Ulmer3 1School of Electrical & Computer Engineering, Purdue University 2Department of Biomedical Engineering, Purdue University 3Department of Radiology, Medical College of Wisconsin
Motivation • Goal: study auditory cortex, language areas • Method: functional MRI • Problem: acoustic scanner noise (ASN) • Loud, distinct “ping” – 115 dB SPL • When: acquisition of an image • Response interaction*; masking; distraction • Objective: characterize and account for ASN interaction with response to a desired stimulus * - Bandettini et al., 1998 and Talavage et al., 1999
Auditory Cortex Figure 1: diagram of the brain in left lateral view Illustration is from Sylvius 2.0 (CD-ROM) by SM Williams.
fMRI • MRI foundation • Blood oxygenation level dependent (BOLD)* • Applied stimulus - cortical activity • Small, time-dependent signal changes Figure 2: MRI gantry at the Medical College of Wisconsin (MCW) (picture by Brosch, Purdue University) * - Ogawa et al., 1990, 1992
Hemodynamic Response Model (Dale and Buckner, 1997) Figure 3: hemodynamic response model
Typical fMRI Event-Related Design Stimulus # slices TR Inter-stimulus interval (ISI) Figure 4: event-related paradigm and hemodynamic response
Acoustic History • ASN History: # slices, TR, volume acquisition • Stimulus History: ISI, duration • Objective: estimate the dependence of response to acoustic stimulus on the acoustic history through controlled variation of these parameters.
fMRI Experiment Parameters • 5 normal-hearing subjects @ MCW • Auditory surface coils* • Clustered volume acquisition (CVA)** • Blipped echo-planar imaging sequence • 1.5 T field strength, 64x64, 20x20 cm FOV • 5 slices (5 mm thickness) • Voxel resolution – 3.125 x 3.125 x 5 mm * - Talavage et al., 2000 ; ** - Edmister et al., 1999,
fMRI Experiment Parameters • Stimulus – 1-s instrumental jazz music snippet • Event-Related paradigm • TR: 1.5, 2.0, 3.0, and 6.0 s • ISI: 12 and 18 s • 16 event-related runs – two runs for each set of parameters • 20 trials/run * 2 runs/set = 40 trials/set
Varying ISI Figure 6: ISI - 12 s vs. 18 s
Varying TR Figure 5: TR - 3 s vs. 6 s
Image Processing Stream • Reconstruction • Motion correction • Alignment with 3d SPGR anatomicals • Registration • Normalization and drift correction • Select and isolate Region of Interest (ROI) • ROI averaging and normalization of HDR estimates • Inter-subject averaging • Plotting estimates of HDR
Experiment Results 12-s ISI 18-s ISI Figure 12: left auditory cortex, 5-subject average
Experiment Results 12-s ISI 18-s ISI Figure 12: right auditory cortex, 5-subject average
Experiment Results Table 1 – Student’s t-test paired two samples for mean, P(T<=t) one-tail, L = left auditory cortex, R = right. Comparison between TR/ISI parameter pairs. Five-subject average.
Attenuation model of HDR • Gamma-variate model: • Incorporate ASN accounting factor into HDR model: ; • Regression: Alliney and Ruzinsky, 1994
Conclusions • TR value affects estimate of HDR in both cortices • Chosen ISI parameters have no significant difference Future Investigations • 8-s vs. 12-s ISI • Vary # slices and stimulus duration • Pulse sequences, field strengths
References Alliney, S, Ruzinsky, SA, “An algorithm for the minimization of mixed L1 and L2 norms with application to Bayesian estimation,” IEEE Trans Sig Proc 42:618–627, 1994. Bandettini PA, Jesmanowicz A, Van Kylen J, Birn RM, Hyde JS, “Functional MRI of brain activation induced by scanner acoustic noise,” Magn Reson Med 39:410-6, 1998. Dale, AM, Buckner, RL, “Selective Averaging of Rapidly Presented Individual Trials Using fMRI,” Hum Brain Map 5:329-340, 1997. Edmister, WB, Talavage, TM, Ledden, PJ, Weisskoff, RM, “Improved Auditory Cortex Imaging Using Clustered Volume Acquisitions,” Hum Brain Map 7:89-97, 1999. Ogawa S, Lee TM, Kay AR, Tank DW, “Brain magnetic resonance imaging with contrast dependent on blood oxygenation,” Proc Natl Acad Sci U S A, 87:9868-72, 1990. Ogawa, S, Tank, DW, Menon, R, Ellermann, JM, Kim, SG, Merkle, H, Ugurbil, K, “Intrinsic signal changes accompanying sensory stimulation: functional brain mapping using MRI,” Proc Natl Acad Sci USA 89:5951-5955, 1992. Talavage, TM, Edmister, WB, Ledden, PJ, Weisskoff, RM, “Quantitative Assesment of Auditory Cortex Responses Induced by Imager Acoustic Noise,” Hum Brain Map 7:79-88, 1999. Talavage, TM, Ledden, PJ, Benson, RR, Rosen, BR, Melcher, JR, “Frequency-dependent responses exhibited by multiple regions in human auditory cortex,” Hearing Research 150:225-244, 2000