Download
1 / 70
710 likes | 839 Views
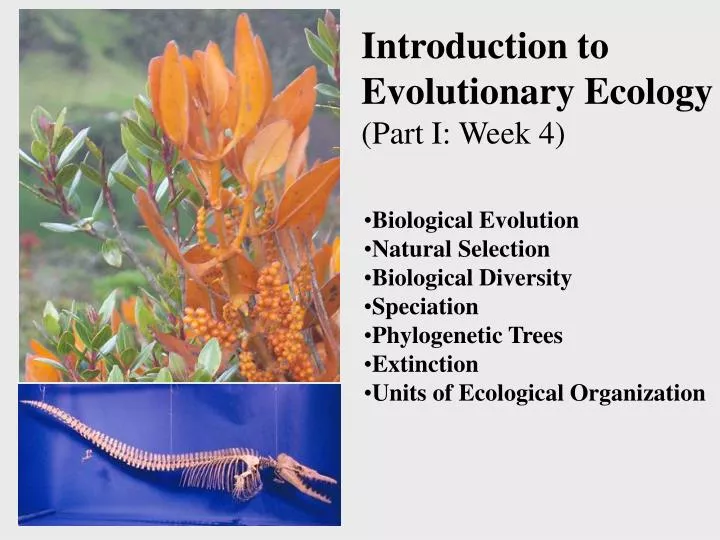
Introduction to Evolutionary Ecology (Part I: Week 4). Biological Evolution Natural Selection Biological Diversity Speciation Phylogenetic Trees Extinction Units of Ecological Organization. Biodiversity.

E N D
Introduction to Evolutionary Ecology (Part I: Week 4) • Biological Evolution • Natural Selection • Biological Diversity • Speciation • Phylogenetic Trees • Extinction • Units of Ecological Organization
Biodiversity • Biodiversity, or biological diversity, is a quantitative description of an area’s organisms, considering the diversity of species, their genes, their populations, and their communities. • A species is a particular type of organism; a population or group of populations whose members share certain characteristics and can freely breed with one another and produce fertile offspring.
Natural Selection • Natural selection rests on three indisputable facts: 1.Organisms produce more offspring than can survive. 2. Individuals vary in their characteristics. 3. Many characteristics are inherited by offspring from parents.
THEREFORE, Some individuals will be better suited to their environment; they will survive and reproduce more successfully. These individuals will transmit more genes to future generations. Future generations will thus contain more genes from better-suited individuals. Thus, characteristics will evolve over time to resemble those of the better-suited ancestors.
Fitness = likelihood that an individual will reproduce and/or the number of offspring an individual produces over its lifetime Adaptive trait, oradaptation = a trait that increases an individual’s fitness
Evidence of natural selection is all around us: 1. In nature … Textbook example: Diverse types of bills in Hawai’ian honeycreepers Figure 4.23a
2. In our domesticated organisms. Dog breeds, types of cattle, improved crop plants—all result from artificial selection Natural selection (and genetic engineering) conducted by human breeders & geneticists.
Speciation • The process by which new species come into being • Speciation is an evolutionary process that has given Earth its current species richness—more than 1.5 million described species and likely many million more not yet described by science. • Allopatric speciation is considered the dominant mode of speciation • Parapatric and (possibly) sympatric speciation also occur.
Allopatric Speciation 1. Single interbreeding population 2. Population divided by a barrier; subpopulations isolated Figure 5.2
3. The two populations evolve independently, diverge in their traits. 4. Populations reunited when barrier removed, but are now different enough that they don’t interbreed.
Phylogenetic trees • Life’s diversification results from countless speciation events over vast spans of time. • Evolutionary history of divergence is shown with diagrams called phylogenetic trees. • Similar to family genealogies, these show relationships among organisms.
Phylogenetic trees • These trees are constructed by analyzing patterns of similarity among present-day organisms. • This tree shows all of life’s major groups. Figure 5.4
Within the group Animals, one can infer a tree of the major animal groups. Figure 5.4
Within the group Vertebrates, one can infer relationships of the major vertebrate groups, and so on… Figure 5.4
Humans and chimps share 96% of the same DNA! http://news.nationalgeographic.com/news/2005/08/0831_050831_chimp_genes.html
Extinction • Extinction is the disappearance of an entire species from the face of the Earth. • Average time for a species on Earth is ~1–10 million years. • Species currently on Earth = • the number formed by speciation • minus the number removed by extinction. Raphus cucullatus
Extinction • Some species are more vulnerable to extinction than others: • Species in small populations • Species adapted to a narrowly specialized resource or way of life
Monteverde’s golden toad was apparently such a specialist, and lived in small numbers in a small area.
End of Cretaceous End of Ordovician End of Devonian End of Permian Now! Quaternary End of Triassic
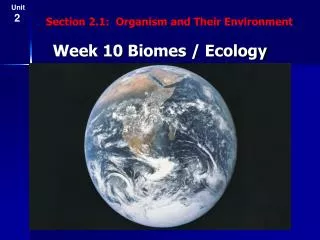
Life’s Hierarchy of Levels Figure 5.7
Ecology deals mainly with levels from the organism up to the biosphere. Figure 5.7
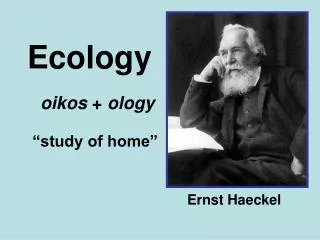
Ecology • The study of: - the distribution and abundance of organisms, - the interactions among them, - the interactions between organisms and their abiotic environments
Habitat and Niche • Habitat = the specific environment where an organism lives (including living and nonliving elements: rocks, soil, plants, etc.) • Niche = an organism’s functional role in a community (feeding, flow of energy and matter, interactions with other organisms, etc.)
Population Ecology • Population = a group of individuals of a species that live in a particular area • Several attributes help predict population dynamics (changes in population): • • Population size • • Population density • • Population distribution • • Age structure • • Sex ratio
Population Size • Number of individuals present at a given timePopulation size for the golden toad was 1,500+ in 1987, and zero a few years later. Population Density • Number of individuals per unit area
Population Density in Central and South America (persons/km2) 1960 2000
Population Distribution • Spatial arrangement of individuals Clumped Random Uniform Figure 5.8
Age structure • Or age distribution = relative numbers of individuals of each age or age class in a population • Age structure diagrams, or population pyramids, show this information. Figure 5.9
Age structure Pyramid weighted toward young: population growing Pyramid weighted toward old: population declining Figure 5.9
Sex ratio • Ratio of males to females in a population • Even ratios (near 50/50) are most common. • Fewer females causes slower population growth. • Note human sex ratio biased toward females at oldest ages.
Population Growth • Populations grow, shrink, or remain stable, depending on rates of birth, death, immigration, and emigration. Population growth rate = (birth rate + immigration rate) – (death rate + emigration rate)
Exponential Growth • Population growth curves show change in population size over time. • Scots pine shows exponential growth Figure 5.10
Exponential Population Growth Projection 0.40 % annual growth 1.21% annual growth (2003-2004 rates extrapolated: data from StatsCan)
Limits on Growth • Limiting factors restrain exponential population growth, slowing the growth rate down. • Population growth levels off at a carrying capacity—the maximum population size of a given species an environment can sustain. • Initial exponential growth, slowing, and stabilizing at carrying capacity is shown by a logistic growth curve.
Logistic Growth Curve Competitors Figure 5.11
Oscillations • Some populations fluctuate continually above and below carrying capacity, as with this mite. Figure 5.12b
Predator-Prey Population Patterns (a form of oscillation) Theoretically, the lynx population expands after the rabbit population expands, until there are so many lynx that the rabbit population crashes again.
Dampening Oscillations • In some populations, oscillations dampen, as population size settles toward carrying capacity, as with this beetle. Figure 5.12c
Crashes • Some populations that rise too fast and deplete resources may then crash, as with reindeer on St. Paul Island. Figure 5.12d
Density Dependence • Often, survival or reproduction lessens as populations become more dense. • Density-dependent factors (disease, predation, etc.) account for the logistic growth curve.
Biotic Potential and Reproductive Strategies • Species differ in strategies for producing young. • Species producing lots of young (insects, fish, frogs, plants) have high biotic potential. • Others, such as mammals and birds, produce few young. • However, those with few young give them more care, resulting in better survival.
r and K-strategists Terms come from: r = intrinsic rate of population increase. (Populations can potentially grow very fast) K = symbol for carrying capacity. (Populations tend to stabilize near K.) • r-strategists • Many offspring • Fast growing • No parental care • K-strategists • Few offspring • Slow growing • Parental care
Community Ecology • Ecologists interested in how populations or species interact with one another study community ecology. • Community = a group of populations of different species that live in the same place at the same time • e.g., Monteverde cloud forest community–golden toads, quetzals, trees, ferns, soil microbes, etc.
Interactions between Trophic Levels Figure 5.14b