Download
1 / 17
170 likes | 362 Views
Establishing standard regional monitoring systems: Lessons Learned from other Hotpots. Will Crosse Conservation International. Strengthening the relationship between local data collection and large-scale data representation through standardized regional biodiversity monitoring

E N D
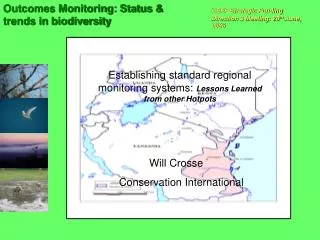
Establishing standard regional monitoring systems: Lessons Learned from other Hotpots Will Crosse Conservation International
Strengthening the relationship between local data collection and large-scale data representation through standardized regional biodiversity monitoring ‘from disparate data to coordinated reporting’
Scales of monitoring and reporting Regional trends identify gaps in conservation priorities at finer scales as well informs management decision making Increase in resolution/detail of data/information Increase in spatial extent of data/information Hotspot Country 1 Country 2 Country 3 Standard & compatible local data required to report regional and global trends. KBA 1 KBA 2 KBA 1 KBA 2 KBA 1 KBA 2
Collection of status & trend data improves our effectiveness to: • Track and assess trends in the status of biodiversity • Assist in demonstrating impact of actions and investments on biodiversity • Justify and direct future conservation, policy and investment decision making • Communicate successes and failures of conservation strategies to government agencies, investment bodies, industry and society as a whole. • Better understand the dynamics of biodiversity components and threats and adapt accordingly. • Contribute to international biodiversity status reporting, e.g. Convention on Biological Diversity and the Millennium Ecosystem Assessment.
Indicators, defined regionally, are globally applicable measures that contribute to Convention of Biological Diversity recommendations. Core Indicators: Red List Index: Change in Red List status of species Protected status of Key Biodiversity Areas Change in habitat cover of Key Biodiversity Areas Fragmentation of habitat in corridors Additional intervention measures: Number of safeguarded Key Biodiversity Areas with governance structures & management plans Percentage of globally threatened species that have ongoing studies that focus on ecology, population, or distribution & monitoring in place
Lessons in data collection, analysis and dissemination from Madagascar: Leveraging and diversifying biodiversity information for multiple actors at multiple scales
Red List Index: Change in IUCN Red List status of species RLI : Measure the relative rate at which the number of sp in each IUCN Redlist category change by tracking genuine change in sp extinction risk between Redlist assessment -B & A: the RLI reveals deterioration in the conservation status over the last two decades
Protected status of KBAs GREEN = Protected KBAs (n=50) RED = Unprotected KBAs (n=114) 164 Key Biodiversity Areas identified by CI and partners based on multiple taxonomic groups (IBAs, IPAs, KBAs)
Change in Protection Status of Conservation Priority Areas: Key Biodiversity Areas, including Alliance for Zero Extinction Sites Time period 1996 – 2006.In Madagascar, 50 of 164 KBAs (30.4%) including 11 of 15 AZE sites (73%), benefit from official safeguard status AZE sites: highly irreplaceable and highly threatened sites that contain the last remaining population of one or more Critically Endangered or Endangered species.
Change in Forest Cover of Madagascar: • Habitat loss over the period of time :1975, 1990, 2000 that can causing species to be threatened with extinction
Change in Habitat Extent in Key Biodiversity Areas, including Alliance for Zero Extinction sites AZE sites had the highest rate of decline in the proportion of habitat cover during 1975 to 1990. During 1990 to 2000 the rate of decline slowed for all KBAs
Change in fragmentation in biodiversity conservation corridors: edge indicator a) proportion of habitat not within 1 km from a non-habitat edge
Change in fragmentation in biodiversity conservation corridors: isolation indicator b) proportion of habitat in patches >100 km2
Reporting: • Can a subset of selected CBD indicators recommended for measuring the 2010 target be adopted to track & report progress at national and regional scales? • Decision-making: • How can biodiversity information be best utilized by government and investment decision makers to guide strategic conservation & sustainable development planning? • What scale of conservation decision making (site, regional & national) and by whom?
Establishing National/Regional Monitoring networks to ensure sustainability and consistency in data collection and reporting.
Monitoring systems held together by five components: • Key stakeholders with defined technical roles & responsibilities • Complementary indicators with standardized measurement protocols • Centralized & compatible data housing and analysis infrastructures • Collaborative dissemination efforts (workshops, publications) • Fundraising strategy driven by multiple partners
Partnerships to strengthen the sustainability of regional biodiversity monitoring. • Stakeholders participation in steering committees. • E.g establishment of Eco-partnership (SW China Hotspot). • Standardizing monitoring methodologies • Development of the National Biodiversity Monitoring Manual (Philippines) • Conducting components of outcomes definition and monitoring. • CI & Wildlife Conservation Society partnership on change detection analysis for Sumatra, Indonesia • Participation in fundraising strategies. • The Biodiversity Monitoring Alliance (Philippines)