Download
1 / 52
610 likes | 838 Views
Vibrating capacitor and surface photovoltage measurements for semiconductor surface studies. BME-EET dr. Mizsei, János Berkeley, 2008. Budapest University of Technology and Economics, Department of Electron Devices. Part of the world heritage. Outline. Introduction Experimental methods

E N D
Vibrating capacitor and surface photovoltage measurements for semiconductor surface studies BME-EET dr. Mizsei, János Berkeley, 2008 Budapest University of Technology and Economics, Department of Electron Devices
Outline • Introduction • Experimental methods • vibrating capacitor: history and theory • C-V methods for characterisation of Metal-SiO2-Si system • vibrating capacitor (and SPV) for surface mapping • Results from oxidized and native oxide covered surfaces • Explanation: band diagrams, Fermi level pinning • Other possibilities of the light excitation and capacitive probes • pn tester: a simplified SPV for conductivity type test • sheet resistance tester by laser light excitation and SPV detection • static charge: touch free Q-V (C-V) diagram, passivation by static surface charge • temperature changing: modified Gray-Brown methode for Dit determination • tunnel current (oxide thickness) test • contactless mapping of fotovoltaic structures and devices • Vibrating capacitor for semiconductor gas sensors • Conclusion
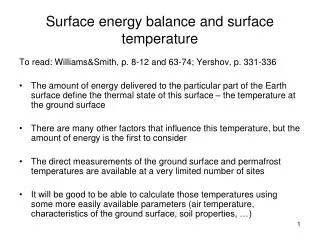
Introduction • the semiconductor surfaces are extremely sensitive to the environment therefore • characterisation of the semiconductor surface (and bulk) properties is extremely important !
A B Higher work function (negative charge on the surface) The CPD: zero electric field between the plates ! Lower work function (electron emission, positive surface charge) CPD compensated: Sheet charges dipole layer
History: Volta: 1801. Lord Kelvin, 1880-90: Phil. Mag.
Schematic draw: Experimental setup of Lord Kelvin
Charge: Capacitance: Current to be detected:
Up to date vibrating capacitor equipment: frequency selectiveamplifying, phase sensitive (multiply) demodulation feedback of the DC voltage (automaticcompensation) optical excitation for surface photovoltage measurements digital realisation second harmonics detection and feedback for distance control surface mapping (x-y scan).
Ideal Voltmeter: I=0 ! …thus no galvanic contact is needed. Than „how to measure?” Detect the electrostatic field by vibrating reference electrode, compensate the electrostatic field, until the field is zero and read the compensating voltage!
MOS structure minority carriers, lifetime t
SiO2-Si structures: MOS • Energy band diagram
Traditional C-V methods • possibilities: Qf Qm Qot Dit Nd Na t • advantages: exact, well developed method, available equipment • disadvantages: electrodes are needed (destructive process), mapping is difficult The surface charge analyser: it is an improved version.
SiO2-Si structures • Energy band diagram
SiO2-Si structures • Energy band diagram during high intensity light excitation
<111> 51 mm diameter wafer Samples: Doping: P-0.01 ohmcm P-5-10 ohmcm N-35-60 ohmcm N-7-20 ohmcm N-0.001 ohmcm • 80 nm thermal oxide on the left side or • 450 nm thermal oxide on the left side • native oxide on the right side Surface:
Vibrating capacitor (Kelvin) method • with transparent reference electrode
Vibrating capacitor and SPV results: P-5-10 ohmcm P-0.01 ohmcm = - - = • V - VFB = Y SPV
Vibrating capacitor and SPV results: ohmcm N-35-60 N-7-20 N-0.001 • V - VFB = Y SPV
Band diagrams: moderately doped p Si • SPV • V - VFB = Y weakinversion inversion inversion
Band diagrams: p+ Si near flat-band (depletion) • SPV • V - VFB = Y • V near flat-band (depletion) near flat-band (depletion)
Band diagrams: n+ Si • SPV • V - VFB = Y • V near flat-band (depletion) near flat-band (accumulation) near flat-band (accumulation)
Band diagrams: moderately doped n Si • SPV • V - VFB = Y accumulation depletion accumulation
Summary of the surface conditions QSS>0 V Y Y V 80nm SiO2 native SiO2
PN testerA simplified SPV for conductivity type test:Basis of operation: ultra thin insulator covered surfaces are in depletion (Fermi level pinning), thus the phase of the SPV signal is characteristic of the bulk conductivity type.
Sheet resistance tester by SPV excitation and detection: model r =5….10 ohmcm
Sheet resistance tester by SPV excitation and detection: simplified model
Sheet resistance tester by SPV excitation and detection: capacitive coupling Test resulted in a good correlation!
Sheet resistance tester by SPV excitation and detection SHR four point probe
Touch free „C-V” (Q-V) method:static charge on the surface • by conducting polymer • by corona discharge • by light excited tunnel current which yields a bias, thus • Qf Qm Qot Dit , • Nd Na can be calculated !
Calibration: static charge on the SiO2 surface by a conducting stamp 2.5, 1.5, -1.5 V Mapping by 0.3 mm step size
Vibrating capacitor Q-V, Q-Y , corona charged Q=00 DQ1 DQ2 DYs Qf
Bands at different temperatures: • Surface voltage mapping at T1 and T2 • Dit can be calculated from the charge difference (dQss) and the work function shift (dW)
T1 Calculation of Dit (modified Gray-Brown method): T2
Results: P 5 ohmcm, 80 nm oxide T2-T1 320 K 300 K 20 K V2 V1 V2 -V1 VFB2 VFB1 VFB2 -VFB1 FB2 -FB1 Y2 Y1 Y2 -Y1 • - = • - • - • - = • - • = • = • = - =
Interface state densities: V2 -V1 Y2 Y1 V2 -V1
Static charge by the strong light excitation:V maps by vibrating capacitor • - • = negative charge on the surface due to the tunnel current from the silicon.
1. equilibrium, steady state 2. non-equilibrium, non-steady state potential transient 3. non-equilibrium, steady state 4. equilibrium, non-steady state
Charging up of an ultrathin oxide covered Si by intensive light excitation Y
Discharge by the tunnel current V V' V'FB
Potential transients: • qualification of ultrathin dielectrics • information storage tunnel current
Solar cells (CIGS, Si) photo SPV map vibrating capacitor maps: in darkness - illuminated = potential barrier
Work function by vibrating capacitor and potential shift calculated from resistance changes
Conclusion • ultrathin insulator covered semiconductor surfaces are near intrinsic (Fermi level pinning!) • static charge: bias for metal free oxide surface • static charge: can be developed by light excitation • memory effect on the ultrathin insulator covered semiconductor surface • vibrating capacitor: reveals the surface potential barrier on photovoltaic devices and semiconductor gas sensors too