Download
1 / 32
320 likes | 489 Views
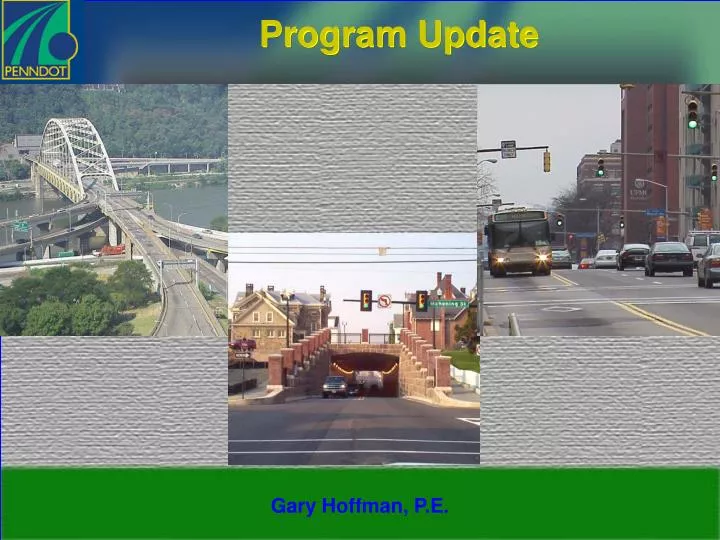
Program Update. Gary Hoffman, P.E. Topics. Partnering Efforts PennDOT’s Strategic Focus Areas PennDOT’s Infrastructure Needs PennDOT’s Program Federal Reauthorization. Partnering Efforts. Quarterly Meetings Pursuing Consistency Expand Constructability Reviews Improving ECMS

E N D
Program Update Gary Hoffman, P.E.
Topics • Partnering Efforts • PennDOT’s Strategic Focus Areas • PennDOT’s Infrastructure Needs • PennDOT’s Program • Federal Reauthorization
Partnering Efforts • Quarterly Meetings • Pursuing Consistency • Expand Constructability Reviews • Improving ECMS • Managing Letting Schedule • Implementing Innovation
PennDot’s Strategic Focus Areas • System Preservation • Management and Productivity • Quality of Life • Mobility • Safety
System Preservation “Maintenance First” Bridge Structural Adequacy • Reduce number of structurally deficient bridges • PA’s structurally deficient bridges = 22% • National average for structurally deficient = 10% • Goal = match the national average within 20 yrs • Increase bridge preservation • Target: $350 M/year for rehab/replacement $100 M/year for preservation • Current Bridge Expenditure $300M
Infrastructure Needs MAKING THE CASE FOR SYSTEM PRESERVATION
Pennsylvania’s Highway & Bridge Needs • Highway Pavement: • 6 Year Needs $ 18.0 Billion • 6 Year Available Funds $ 13.2 Billion • Gap $ 4.8 Billion • Bridges: • 6 Year Needs $ 3.3 Billion • 6 Year Available Funds $ 1.8 Billion • Gap $ 1.5 Billion • 6 Year Funding GAP $ 6.3 Billion
2003 System PreservationInternational Roughness Index (IRI) GoodFairPoor Interstate 64% 29% 7% NHS(Non-interstate) 59% 30% 11% Non-NHS > 2000 ADT 63% 25% 12%
Pavement DeteriorationCurve Pavement Preservation • Programming Preservation Treatments for roads at key times will extend the life of the road greatly
Proposed Statewide Goal • Improve all “POOR” NHS and Interstate miles • Focus on Preservation instead of reconstruction to keep the good roads good
System Preservation Pennsylvania Bridge Facts • Median Age > 50 yrs • Average Life Span – 50 yrs • Average Cost/Bridge - $1.25M $1.25M X 9352 deficient bridges = $11.7 B
Trend in Structurally Deficient BridgesPENNDOT Bridges > 8 ft. $150M/yr $300M/yr $450M/yr Local Bridges > 20 ft = 26.9% in 2003
Proposed Statewide Goal • Reduce Structurally Deficient Bridges to the National Average of 10% by 2024 • Bridge preservation can reduce rehabilitation and replacement requirements
Improve Bridge Management • Designate Bridge “Champion” (Craig Beissel) • Rebuild Legacy BMS System • Participate in National Effort for Robust Bridge Asset Management System • Bridge Bill Legislation
Bridge NeedsAsset Management • Preservation - Fix leaky joints (expansion dams) - Fix beam ends, bearings and supports - Bridge Painting - Deck patching/replacement - Other
Annual Lettings Millions $1,300 $1,250
2004 Lettings Millions
2005 Lettings Millions
Materials Usage 200320042005 Asphalt (Tons)8.2 M 8.1 M 8.3 M Concrete (CY) 740 k 660 k 670 k Aggregate (Tons) 12.3 M 14.8 M 12.9 M
Number of Consultant Final Selections Actual ToDate Projected TEA 21 ACT 3 127
Payouts to Consultants Millions Actual To Date Projected 254
Federal Reauthorization (?) • 5 short term extensions • 8 mos. through May 2005 • Current extend ($36.8 + $1.8 B) • Funding guarantees and firewalls • Nothing during “lame duck” • Reintroduced late-winter/early spring
Federal Reauthorization (?) • Size Of Appropriation • “Growth” of Appropriation Over Time • Distribution Mechanism • Earmarks • Categorization/Flexibility • Speak With “One Voice”
SIX YEAR PROGRAM (Pennsylvania’s Estimated Funding) Federal Reauthorization 20% vs. 40%