Download
1 / 21
210 likes | 326 Views
The Non-Flare Temperature and Emission Measure Observed by RHESSI and SXI. J.McTiernan (SSL/UCB) J.Klimchuk (NRL) Fall 2003 AGU Meeting. Abstract:

E N D
The Non-Flare Temperature and Emission Measure Observed by RHESSI and SXI J.McTiernan (SSL/UCB) J.Klimchuk (NRL) Fall 2003 AGU Meeting
Abstract: Since RHESSI was launched in February 2002, it has observed thousands of solar flares. It also observes solar emission above 3 keV when there are no observable flares present. In this work we present measurements of the non-flare Temperature and Emission Measure for the period from Feb. 2002 through Oct. 2003. Since RHESSI is an imaging spectrometer, we locate the source of the emission when possible. Preliminary results show that the source can be associated with active regions.
Figure 1: This is a plot of the RHESSI count rates for a full orbit from 17-Feb-2003. Note the higher low energy count rate (black line = 3 - 6 keV) during spacecraft day. This is solar emission. The interval used for imaging is shown by the vertical black lines. It was chosen because it has the lowest count rate in the 3-6 keV range, and is also flat, with a standard deviation in the counts of less than 1.5*sqrt(N). Also no flares, attenuators in, data gaps, decimation, periods of high magnetic latitudes, or particle events.
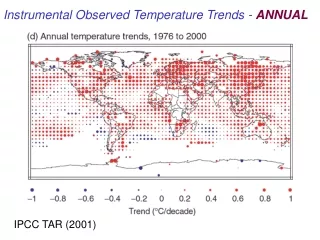
Figure 2: Left: RHESSI image of the full sun. Right: Same image with a contour image pf the SXI P_MED_A image overlaid. There are two sources on the limb, that correspond to active regions.
This is unusual. There were 764 intervals between 1-Feb-2003 and 1-Sep-2003 tested by comparing the RHESSI images with SXI images. 609 showed no discernable RHESSI source, (identified by the rings in the image) probably due to not enough available photons. (We hope to improve this with improved imaging techniques.) 140 showed 1 source, corresponding with an active region. 15 showed 2 sources, on different active regions.
Figure 3: Background selection is important. This is a plot of the 3 to 25 keV background rate as a function of spacecraft latitude.
The non-solar background is measured for 5 minute periods before and after the daylight portion of each orbit. Since the RHESSI background level is determined mostly by spacecraft position, we created a database of background rates from all of the pre and post daylight intervals for the mission. As long as the intervals in which the spacecraft is at high latitude are avoided, the background doesn’t vary much, as can be seen. The intervals used for temperature measurement were chosen to be at low latitude, to keep the background level low.
Figure 4: This is a sample spectral fit for an interval during the “quiet” interval shown in Figure 1. The fit routine uses the CHIANTI package (version 4.2, see Dere et al., 1997; AASS, 125, 149, Young et al., 2003; ApJSS, 144, 135) which includes lines, in particular the Fe line complex between 6 and 7 keV, but there is no evidence for line emission in the non-flare RHESSI data. For this interval the temperature is 6.7 MK, and the emission measure is 1.4e47 cm-3. These are typical numbers.
Figure 5: Fe line test: For a sample of 827 non-flare time intervals, we fit continuum thermal spectra, not including the 6.33 to 7 keV channel, where we might expect to see the Fe line. Then we compared the count rate in that channel with the expected counts and look for an excess rate in that channel. The plot is of (obs.counts - expected counts)/sigma(counts). Temperatures are typically between 6 and 8 MK. If there is a noticeable Fe line component, we would expect the number to be pretty high. Of 827 total events, 731 are less than 1 sigma 68 between 1 and 2 sigma, 24 between 2 and 3 sigma, and 4 above 3 sigma. So it does not look as if there is a noticeable low T Fe line component.
Figure 6: The top plot is the measured Emission Measure in units of 1047 cm-3 for 1785 measurements between 12-Feb-2002 and 1-Nov-2003. The bottom plot is the Temperature in MK. The dashed red line is the daily sunspot number, normalized to a peak of 8, which is used here as a measure of solar activity. Of the 1785 measurements, 228 returned 0 for EM and T; these had total count rates in the 3-12 keV band less than the background rate. The zero measurements are concentrated at times with low activity. Unfortunately it is difficult to get “quiet” sun measurements during times of high activity, so there are gaps in the measurements during active periods.
Conclusions: • There is typically a high T(6-8) MK source present on the sun even for periods with no observable flare activity. • The high T emission is greater during active periods, and can disappear during quiet periods. • When we are able to determine a source position for RHESSI, that position corresponds to 1 or 2 active regions.
The Full-sun Differential Emission Measure from 1 to 10 MK Using SXI and RHESSI data. RHESSI only observes the hottest part of the solar DEM; in order to get a better handle on the DEM, we have done some preliminary work combining GOES 12-SXI data and RHESSI. SXI data and analysis tools can be found at the NOAA website: http://sec.noaa.gov/sxi/index.html. The SXI has multiple analysis filters with different broad-band temperature responses. SXI takes one image per minute, typically with the ‘P_MED’ and ‘B_THN’ filters. Once every 6 hours, the SXI cycles through all of its filters. We found 4 intervals from the 1000 used for this study that were close enough to a full set of SXI images for a try at a multi-instrument DEM calculation.
Figure 5: This shows normalized T response curves for two of the SXI filters and two RHESSI channels. The ‘P_MED’ SXI filter has a broad response with a peak at about 3.9 MK. The ‘B_MED’ filter has a broader response that peaks at 10 MK but has a noticeable response at much lower T. The RHESSI channels have response curves that increase rapidly with increasing T. If there is any high-T plasma present, it will have a dominant effect on the RHESSI count rate. For the DEM calculations, the full image is used; since we have not yet imaged the RHESSI sources, a spatially resolved DEM cannot be used. The DEM calculation is done using the histogram-DEM method described in McTiernan, Fisher & Li, 1999, Apj 514, 472 for YOHKOH SXT and BCS.
Figure 6: These are plots of the DEM for the four “quiet” intervals with good SXI coverage. Nothing wildly surprising, the DEM is high at low T and decreases with increased T. The results would be similar to a model of loops heated by nanoflares presented by Klimchuk and Cargill Apj 553, 440, except for the fact that the Klimchuk-Cargill DEM has a peak near 3 MK, and this DEM does not show a peak. It is possible that a DEM calculation concentrating on one active region, instead of the whole sun, could show such a peak. It is also true that these measurements were obtained at relatively quiet times and the temperature may just be that low.
In any case, verification of solar heating models will require DEM’s for individual active regions and the inclusion of lower T (e.g. EIT) observations with the SXI and RHESSI data to extend the calculation.