Download
1 / 20
230 likes | 458 Views
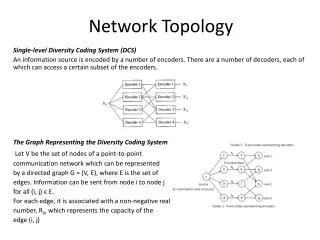
Graph-based analysis of biochemical networks. Network topology. Connectivity - definition. In a non-directed graph The degree ( k) of a node is the number of edges for which it is an endpoint. In a directed graph

E N D
Graph-based analysis of biochemical networks Network topology Jacques.van.Helden@ulb.ac.be Université Libre de Bruxelles, Belgique Laboratoire de Bioinformatique des Génomes et des Réseaux (BiGRe) http://www.bigre.ulb.ac.be/
Connectivity - definition • In a non-directed graph • The degree (k) of a node is the number of edges for which it is an endpoint. • In a directed graph • The in-degree (kin) of a node is the number of arcs for which it is the tail. • The out-degree (kout) of a node is the number of arcs for which it is the head. • The degree of a node is the sum of in-degree and out-degree • k=kin+kout
Graph types • Homogeneous networks • Pairs of nodes are connected with a constant random probability • The connectivity follows a Poisson law • P(k) ~ ke-/k! • mean number of connections per node • k number of connections for a given node • The probability of finding a highly connected node decreases exponentially with connectivity. • Scale-free networks • A few nodes are highly connected, most nodes are poorly connected. • Can be generated randomly with a model where new nodes are preferentially connected to already established nodes • The connectivity follows a power law • P(k) ~ k- • the slope of the distribution in a log-log graph. • k number of connections for a given node Jeong, H., B. Tombor, R. Albert, Z.N. Oltvai, and A.L. Barabasi. 2000. The large-scale organization of metabolic networks. Nature407: 651-654.
Poisson distribution • Remark: in the preceding slide, the Poisson distribution is displayed in linear coordinates, whereas the power law is displayed in log-log • To compare the Poisson to the Power-law distribution, one needs to display both in log-log coordinates.
Poisson distributions • The shape of the Poisson distribution depends on the mean.
Degree distribution (connectivity) in the metabolic network • Jeong et al. (2000) calculate compound connectivity and show that it follows a power-law. Jeong, H., B. Tombor, R. Albert, Z.N. Oltvai, and A.L. Barabasi. 2000. The large-scale organization of metabolic networks. Nature407: 651-654.
Compound degree in the KEGG/LIGAND metabolic network (version 2006) Data source: KEGG/LIGAND, 2002 version van Helden, J., L. Wernisch, D. Gilbert, and S.J. Wodak. 2002. Graph-based analysis of metabolic networks. In Ernst Schering Res Found Workshop (ed. M.H.-W.e. al.), pp. 245-274. Springer-Verlag.
Reaction degree in the KEGG/LIGAND metabolic network (version 2006) Data source: KEGG/LIGAND, 2002 version van Helden, J., L. Wernisch, D. Gilbert, and S.J. Wodak. 2002. Graph-based analysis of metabolic networks. In Ernst Schering Res Found Workshop (ed. M.H.-W.e. al.), pp. 245-274. Springer-Verlag.
Reaction degree - without ubiquitous compounds Data source: KEGG/LIGAND, 2002 version van Helden, J., L. Wernisch, D. Gilbert, and S.J. Wodak. 2002. Graph-based analysis of metabolic networks. In Ernst Schering Res Found Workshop (ed. M.H.-W.e. al.), pp. 245-274. Springer-Verlag.
Properties of graphs with power-law degree distribution • Small-world property • The distances between pair of nodes shows are very short. • The distribution of distances between pairs of compounds in the metabolic network peaks at 3 (Figure a). • This reflects the utilization of shortcuts through the highly connected nodes (the « hubs »). • Scale-free property • When only a subset of the network is selected (e.g. the reactions catalyzed in a organisms with lower number of enzymes), the average distance is conserved (Figure b). • Robustness to random node deletions • Sensitivity to directed attacks • When the most connected nodes (“hubs”) are removed from the network, the average distance rapidly increases (Figure e). Jeong, H., B. Tombor, R. Albert, Z.N. Oltvai, and A.L. Barabasi. 2000. The large-scale organization of metabolic networks. Nature407: 651-654.
Connectivity in protein interaction networks • Jeong et al (2001) calculate the degree of each protein in a protein interaction network. • Their degree distribution follows a power law. • They observe that highly connected proteins correspond to essential proteins. Jeong, H., S.P. Mason, A.L. Barabasi, and Z.N. Oltvai. 2001. Lethality and centrality in protein networks. Nature411: 41-42.
How scale-free are biological networks ? • After the first publications of Barabasi’s group, the scale-free property became very popular, and many other groups applied the same topological analysis to various types of biological networks. • Remarkably, nobody actually tested the fit between the power law and the observed degree distribution. • In 2006, Khanin and Wit did the statistical test for 12 networks previously claimed to follow a Power law. None of them passed the test.
Clustering coefficient • The clustering coefficient of a node i indicates the density of arcs among its neighbours. • It is computed as the ratio between the number of arcs (n) between the neighbours, and the maximal number of such arcs (M). • The maximal number of arcs depends on the graph type • Directed or undirected • With or without self-loops
Modularity and hierarchy • Ravasz et al (2002) calculate the clustering coefficient of all the nodes of the metabolic network. • They observe that • The average clustering coefficient is 10 times higher than what would be expected form scale-free networks. • This clustering coefficient is size-independent, whereas in scale-free networks it is expected to decrease as N-0.75 • To account for this type of behaviour, they propose a new generative model, and they define a new type of networks: hierarchical networks. • Figure 1 from Ravasz et al (2002) • A. Power-law network. • B. Modular network. • C. Hierarchical network. Ravasz, E., A.L. Somera, D.A. Mongru, Z.N. Oltvai, and A.L. Barabasi. 2002. Hierarchical organization of modularity in metabolic networks. Science297: 1551-1555.
Graph-based analysis of biochemical networks Biological interpretation of topological network properties Jacques.van.Helden@ulb.ac.be Université Libre de Bruxelles, Belgique Laboratoire de Bioinformatique des Génomes et des Réseaux (BiGRe) http://www.bigre.ulb.ac.be/
Biological hypotheses • Various hypotheses were proposed to interpret the topological properties of the metabolic graph. • Small world • small diameter would allow a rapid response of the cell to environmental changes. • Scale-freeness -> robustness • scale-free networks are tolerant to random deletion of node (but sensitive to directed attacks). • Centrality • central compounds could have appeared earlier in the evolution of metabolism. • I am quite sceptical about these interpretations of metabolic network connectivity, for the reasons detailed hereafter.
Remarks and questions about the biological interpretation of metabolic network topology • Highly connected compounds in the metabolic network • For biochemists, the high connectivity has an obvious interpretation: highly connected nodes are involved in particular types of reactions • Phosphorylation • Oxydo-reduction • Methyl transfer • … • Sensitivity to directed attacks • Is it possible to « delete » a highly connected compound from the metabolism of an organism ? • Mutations can delete enzymes (and thus prevent catalysis of selected reactions). • To “delete” a compound like H2O from the metabolic graph, you need to inactivate/suppress hundreds of enzymes ! • Small diameter • What is the relationship between the shortest path in the metabolic graph and metabolic pathways ?
Graph-based analysis of biochemical networks Identifying modules in biochemical networks Jacques.van.Helden@ulb.ac.be Université Libre de Bruxelles, Belgique Laboratoire de Bioinformatique des Génomes et des Réseaux (BiGRe) http://www.bigre.ulb.ac.be/
Connectivity and clustering • Gagneur (2003) implement a clustering algorithm based on connectivity: poorly connected nodes are clustered first, highly connected nodes later. • When they apply this algorithm on the metabolic network, the clusters correspond to metabolic pathways. Gagneur, J., D.B. Jackson, and G. Casari. 2003. Hierarchical analysis of dependency in metabolic networks. Bioinformatics19: 1027-1034.
References and links • Barabasi’s group • Jeong, H., Tombor, B., Albert, R., Oltvai, Z. N. & Barabasi, A. L. (2000). The large-scale organization of metabolic networks. Nature 407, 651-4. • Jeong, H., Mason, S. P., Barabasi, A. L. & Oltvai, Z. N. (2001). Lethality and centrality in protein networks. Nature 411, 41-2. • Ravasz, E., Somera, A. L., Mongru, D. A., Oltvai, Z. N. & Barabasi, A. L. (2002). Hierarchical organization of modularity in metabolic networks. Science 297, 1551-5. • Ravasz, E. & Barabasi, A. L. (2003). Hierarchical organization in complex networks. Phys Rev E Stat Nonlin Soft Matter Phys 67, 026112. • Cellular networks (publications by Barabasi’s group) • http://www.nd.edu/~networks/cell/ • Wagner & Fell • Fell, D. A. & Wagner, A. (2000). Structural properties of metabolic networks: implications for evolution and modelling of metabolism. In Animating the cellular map (Hofmeyr, J.-H. S., Rohwer, J. M. & J.L., S., eds.), pp. 79-85. Stellenbosch University Press, Stellenbosch. • Fell, D. A. & Wagner, A. (2000). The small world of metabolism. Nat Biotechnol 18, 1121-2. • Gagneur • Gagneur, J., D.B. Jackson, and G. Casari. 2003. Hierarchical analysis of dependency in metabolic networks. Bioinformatics19: 1027-1034. • How scale-free are biological networks ? • Khanin, R. and Wit, E. (2006). How scale-free are biological networks. J Comput Biol 13, 810-8.