Download
1 / 31
310 likes | 392 Views
Tormentas cálidas en Chile central René D. Garreaud Departamento de Geofísica Universidad de Chile. 28 de Mayo 2014 – DMC, Santiago. Agradecimientos: Fondecyt 1110169, José Rutllant , Robert Rondanelli. Temario Revisión de trabajos previos

E N D
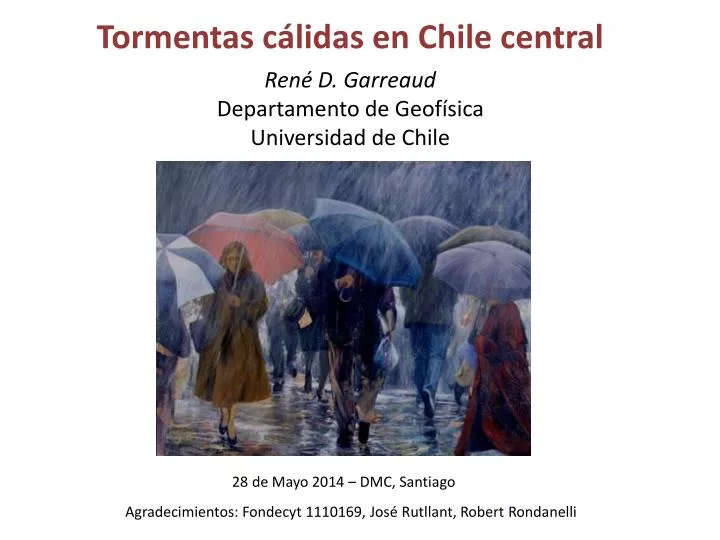
Tormentas cálidas en Chile central René D. Garreaud Departamento de Geofísica Universidad de Chile 28 de Mayo 2014 – DMC, Santiago Agradecimientos: Fondecyt 1110169, José Rutllant, Robert Rondanelli
Temario • Revisión de trabajos previos • Datos (Diarios DMC; 15’ DGF; CFSR; TMI/SMI…) • Variabilidad de la línea de nieves e impactos hidro. • Tormentas cálidas y frías • Caso de estudio (Julio 2006) • Análisis compuesto • Modelo conceptual y conclusiones
Background Sistema Frontal + DepresiónExtratropical Martes 20 de Mayo de 2014 ¿Que elemento(s) de gran escala son un buen predictor de la cantidad de precipitación?
Background Falvey & Garreaud 2007: Composite fields and Radiosonde profiles (local conditions) of CCh precipitation events.
Background Viale and Nuñez 2011: NNR Composite fields of CCh precipitation events. Extreme events exhibit sharper / more intense features than intense events.
Background Barret et al. 2012: Composite fields (QS sfc. Wind, TRMM, Z500, etc.) of CCh precipitation events. More amplified/slower systems cause more precipitation
Background Falvey & Garreaud 2007 Statistically robust correlation between CCh rainfall and low-level zonal moisture transport
Background Garreaud et al. 2013. Using PRECIS-ERA40 data, they show that strong (local) correlation between 850 hPa zonal wind and precipitation extends along south-central Chile because of the orographic enhancement in the windward side of the Andes a. r(U850,P) (a) (P,U850)Anual -0.8 -0.4 0 +0.4 +0.8
Eventos de precipitación también difieren en su temperatura 20 15 10 5 0 2900 2090 1320 Temperatura [°C] Altura Iso. 0°C [m] Tormenta fría Precipitación [mm/15 min] 20 15 10 5 0 2900 2090 1320 Altura Iso. 0°C [m] Temperatura [°C] Tormenta Cálida Precipitación [mm/15 min] 1 día ¿Es diferente el ambiente sinóptico entre TF y TC? ¿Cuan hábiles son los MPN en predecir Temp-Tormenta?
Hydrological Impacts Maipo en el Manzano riverbasin Potential Volume: P(h)dA Mean FL 3 May 1993 11 Jul 2006 Mean FL Area below snow V=1 PDF Freezinglevel at SDO duringrainfallevents in Stgo V=2 snow FL Mean FL Height [m ASL]
Freezing level variability during winter storms (MJJAS) Ground based: Hsfc + Tm/sat Interpolated from Radisonde
Warm and cold winter rainstorms Warmstorms (30%) Coldstorms (65%)
Warm and cold winter rainstorms 6 4 2 0 -2 Composite local conditions (DGF, 30 min, 2004-11) during cold (44) and warm (22) rainstorms Surfacepressure [hPa] [T]P12.5°C H0 2900 m Air Temperature [°C] [T]P7.0°C H0 1700 m 2 1 0 Precipitation Time [hrwrtstormonset]
Tormentas en Nahuelbuta +3 +2 +1 0 -1 -2 +2 +1 0 -1 -2 °C T(4000 m) °C T(1200 m) +2 +1 0 -1 -2 Frontal passage °C SAT 4 3 2 1 0 Rainfall Obs. Time [hr]
Uniform Precipitation Group exhibits colder conditions (H0 = 1900 m) Mountain Enhanced Precipitation Group exhibits warmer conditions (H0 = 2900 m)
DGF station Case of study: July 2006 Sto. Domingo radiosonde Sto. Domingo radiosonde
Case of study: July 2006 Upperbasinstations Lowerbasinstations
Case of study: July 2006 Wind profiles at Santo Domingo 12Z 11Jul 2006 Climo. data from FG2007
Case of study: July 2006 14Z 11jul2006 GOES12 IR2 + CFSR 500 hPawinds 14Z 07jul2006
Case of study: July 2006 12 July 2006 GOES-12 VIS (1445 UTC) + TRMM_3B42 dailyprecip. 11 July 2006
Case of study: July 2006 950 hPawinds, temperature and precipitation 18Z 11 Jul 2006
Case of study: July 2006 Lon-heightcrosssections at 33°W, 18Z 11 Jul 2006
Case of study: July 2006 Lat-heightcrosssections at 77°W, 18Z 11 Jul 2006
Case of study: July 2006 200 hPawinds, IPW and SLP. 12Z 11 Jul 2006
12z03jul 12z05jul 12z07jul Case of study: July 2006 12z09jul 12z11jul 12z12jul
Case of study: July 2006 (b) SMI vapor and QS winds AM pass 11 Jul 2011 (a) TMI vapor and QS winds
TRMM_3B42 July 2006 07jul 08jul 09jul Case of study: July 2006 10jul 11jul 12jul
Hovmollersection at 55°S of SLP Case of study: July 2006
Large scale composite analysis: IPW & 200 hPa wind CFSR averages for cold (44) and warm (22) rainstorms
Large scale composite analysis: SLP’ & T500’ CFSR averages for cold (44) and warm (22) rainstorms
Conceptual Model • Rainfall at and behind cold front • H0 < 2500 m ASL • Prefrontal rainfall up in the Andes • Well defined baroclinic wave • Deep cyclone off southern Chile • NW flow aloft • Strong topographic blocking • Northerly low-level jet • Rainfall well ahead cold front • H0 > 2500 m ASL • Strong W flow aloft • Conditionally unstable environment • Reduced topographic blocking • Wide, deep layer of ascent • Weak trough farther south • Blocking anticyclone farther west • TransPacific zonal jet and troposheric river