Download
1 / 13
130 likes | 264 Views
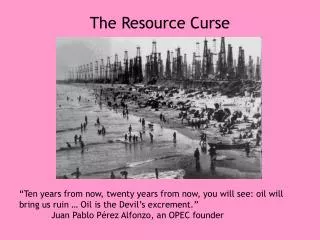
Replicating Sachs and Warner: Sources of Slow Growth in African Economies Graham A. Davis Division of Economics and Business Colorado School of Mines York, England September 2011. The Sachs and Warner Resource Curse Data. (primary exports/GDP, 1970).

E N D
Replicating Sachs and Warner:Sources of Slow Growth in African EconomiesGraham A. DavisDivision of Economics and BusinessColorado School of MinesYork, EnglandSeptember 2011
The Sachs and Warner Resource Curse Data (primary exports/GDP, 1970)
Sources of Slow Growth in African Economies (JAE 1997) Three Groups of Developing Economies • Sub-Saharan Africa • Fast Growth Seven (Indonesia, Malaysia, Hong Kong, Singapore, Thailand, Taiwan,S. Korea) • All Others (the “average” non-African developing country)
Why the Slower Growth in Africa? • Geography? • Landlocked, tropics, resource curse • Demographics? • Rapid population growth, poor health • Policy? • Low government savings, infrequent trade openness, poor institutional quality • Special ‘Africa’ Theory? • Africa dummy
Summary of African Growth Lag v. Average ‘Other Developing Country’ NB: regressions only include 20 of the 46 SSA countries, with sample average growth of 0.46 v. SSA growth of ~ 0.80.
African Growth Lag from Not Adopting ‘Fast Country’ Policies
“…our final estimate is that a country with African structure and LDC policies could have grown at 1.4% (GD: 1.0%) per year [rather than the realized growth rate of 0.80% per year].” “…we estimate that Africa could have achieved per capita growth of 4.3% (GD: 4.7%) per annum if it had followed fast-growth policies.”
SW Conclusion “Our regression evidence suggests that part of the explanation for Africa’s slow growth lies with natural factors… However, the evidence also suggests that basic economic policies such as openness to international trade, government saving and market-supporting institutions have had an even larger quantitative impact on economic growth rates.” GD: True if one compares African policies to fast-growing country policies. Not true if one compares African policies to ‘other developing country’ policies.