Download

1 / 29
290 likes | 377 Views
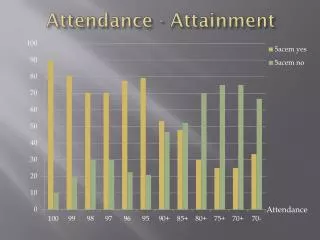
2013-14 Attainment. Peter Gorrie, QIO September 2014. Title. From CEC Assessment Framework, 2012. Trends Standards of Attainment over time. P4-P7 Maths Progress (10/11 to 13/14).

E N D
2013-14 Attainment Peter Gorrie, QIO September 2014
Title From CEC Assessment Framework, 2012
Trends Standards of Attainment over time
P4-P7 Maths Progress (10/11 to 13/14) These graphs shows the performance of the cohort of P4 pupils tested in 2010/11 and then the same cohort tested in P7 last session. Stanine Band Progress Mean Score Progress • There are less children (≈7%) scoring a mean score less than 89. • The mean score has increased (≈1%). • There are more children (≈6%) scoring a mean score more than 112. Assessments - 2010-11 Suffolk Reading Test, 2013-14 – New Group Reading Test
P7-S2 Maths Progress (10/11 to 13/14) These graphs shows the performance of the cohort of P7 pupils tested in 2010/11 and then the same cohort tested in S2 last session. Stanine Band Progress Mean Score Progress • There are less children (≈18%) scoring a mean score less than 89. • The mean score has increased (≈6%). • There are more children (≈9%) scoring a mean score more than 112.
Maths Mean Score Trend • Maths Mean Scores • P7 maths mean score has improved each year for the last four years • P4 maths mean score has improved since 2010 • But • P4 maths mean score has fluctuated • P4 and P7 maths mean remains below UK mean of 100.
Literacy Progress These graphs shows the performance of the cohort of P4 pupils tested in 2010/11 and then the same cohort tested in P7 last session. • There are less children (≈11%) scoring a mean score less than 89. • The mean score has increased (≈3%). • There are more children (≈5%) scoring a mean score more than 112.
CfE Levels % Pupils with Levels – at or better than expected level eg if a school enters data for 1 pupil who achieves a level they will have 100% ! % Pupils on roll - at or better than expected level
Pim5 Distribution • Girls performing well at higher stanines. (and better than boys at lower stanines) • BUT • The distribution of scores is lower than UK average • Mean male score is 97.0%, mean female score is 99.6%. • Overall mean standard age score is 98.3%. Better than P4 & P7.
P1 Pim5 2013-14 • Performing above UK average in all 4 process areas. • Performing above UK average in the 2 assessed categories of number and shape. Process • 9% better than UK average in number Content
YARC Distribution • There is a positive distribution. CEC cohort has fewer children than UK in “Very low, Below average and average stanines”. • There are more CEC pupils in the “above average and very high” stanines than UK average. • The mean score across all categories is higher than UK. • Early word recognition and sound deletion were the aspects which performed least well.
P1 YARC and Maths Distribution Comparison YARC P1 2013/14 Pim5 P1 2013/14 Overall performance in YARC at P1 is better than that of Maths.
P4 Reading Distribution • Girls at P4 performing consistently well. Mean Score – 100.8 • Edinburgh generally following Uk trend with the overall mean 99.1 • BUT • Boys at P4 performing less well than girls across stanine distribution. • P4 male mean score is 97.6
P4 Maths Distribution P4 Maths Distribution 2013-14 • The percentage of pupils < 89 has decreased since 10/11. • The percentage of pupils ≥ 112 has increased since 10/11. • BUT • The distribution of scores is lower than UK average. • Boys at lower stanines perform less well than girls, however at the upper stanines boys perform better than girls.
P4 Performance • 3 Year Improvement across all process category areas and in the content area of number. Process • BUT* • Performing below UK average in Number (21), Shape … (10) and Algebra (2) • Performing below UK average in knowing facts and procedures and using concepts Content * Number of marks in brackets
P4 Questions • There has been an overall improvement in the number of questions which P4 are answering successfully • however • there are key aspects in understanding and application of number processes that have a negative performance in relation to the UK
P4 Reading and Maths Distribution Comparison Reading P4 2013/14 Mathematics P4 2013/14 Overall performance in reading at P4 is better than that of Maths.
P7 Reading Distribution • Girls at P7 performing consistently well. Mean Score – 105.7 • Positive distribution of scores compared to UK. CEC Mean 104.4 • P7 boys mean score is 103.2 • BUT • Boys at P7 performing less well than girls across stanine distribution.
P7 Maths Distribution • The percentage of pupils < 89 has decreased by 6% since 10/11. • The percentage of pupils ≥ 112 has increased by 4% since 10/11. • The mean score has increased each year • BUT • The distribution of scores is lower than UK average. • Boys at lower stanines perform less well than girls, however at the upper stanines boys perform better than girls. (This being the same as P4)
P7 Performance • 3 Year Improvement across all process category areas and in the content area of number. Process • BUT* • Performing below UK average in Number (22), Shape … (15), Data Handling (12) and Algebra (3) • Performing below UK average in all processes. Content * Number of marks in brackets
P7 Questions • There has been an overall improvement in the number of questions which P7 are answering successfully • However • There continues to be more questions answered wrongly than correctly relative to UK performance. • Like P4 there are key aspects in understanding and application of number processes that have a negative performance in relation to the UK
P7 Reading and Maths Distribution Comparison Reading P7 2013/14 Mathematics P7 2013/14 Overall performance in reading at P7 is better than that of Maths.
Mathematics PiM11 What are the features of effective learning and teaching in mathematics? • planned active learning which provides opportunities to observe, explore, investigate, experiment, play, discuss and reflect • modelling and scaffolding the development of mathematical thinking skills • learning collaboratively and independently • opportunities for discussion, communication and explanation of thinking • developing mental agility • using relevant contexts and experiences, familiar to young people • making links across the curriculum to show how mathematical concepts are applied in a wide range • of contexts, such as those provided by science and social studies • using technology in appropriate and effective ways • building on the principles of Assessment is for Learning, ensuring that young people understand the purpose and relevance of what they are learning • developing problem-solving capabilities and critical thinking skills • CfE Principles and Practice Mathematics, Page 2
CfE Levels % Pupils on roll - at or better than expected level % Pupils with Levels – at or better than expected level