Download
1 / 28
280 likes | 570 Views
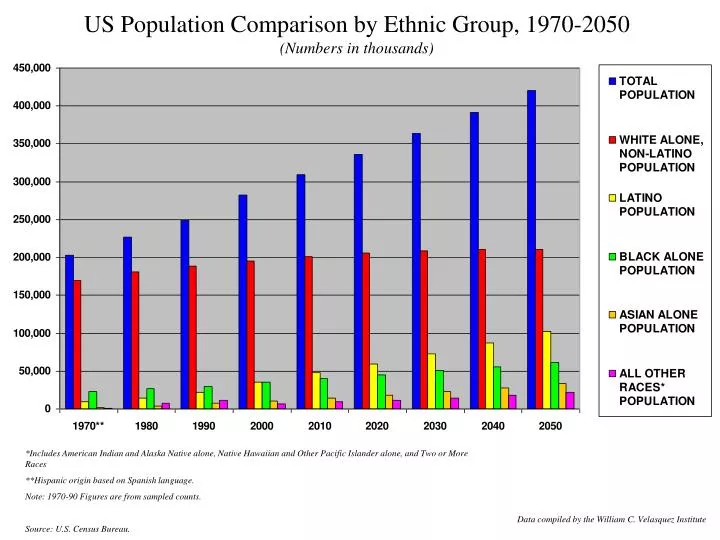
US Population Comparison by Ethnic Group, 1970-2050 (Numbers in thousands). *Includes American Indian and Alaska Native alone, Native Hawaiian and Other Pacific Islander alone, and Two or More Races **Hispanic origin based on Spanish language. Note: 1970-90 Figures are from sampled counts.

E N D
US Population Comparison by Ethnic Group, 1970-2050 (Numbers in thousands) *Includes American Indian and Alaska Native alone, Native Hawaiian and Other Pacific Islander alone, and Two or More Races **Hispanic origin based on Spanish language. Note: 1970-90 Figures are from sampled counts. Source: U.S. Census Bureau. Data compiled by the William C. Velasquez Institute
US Population Shares by Ethnic Group, 1970-2050 *Includes American Indian and Alaska Native alone, Native Hawaiian and Other Pacific Islander alone, and Two or More Races **Hispanic origin based on Spanish language. Note: 1970-90 Figures are from sampled counts. Due to aggregation of Hispanic figures, percentages do not equal 100%. Source: U.S. Census Bureau. Data compiled by the William C. Velasquez Institute
Growth of Total U.S. Population by Ethnic Group, (1970-2050) (Numbers in thousands) *Includes American Indian and Alaska Native alone, Native Hawaiian and Other Pacific Islander alone, and Two or More Races **Hispanic origin based on Spanish language. Note: 1970-90 Figures are from sampled counts. Source: U.S. Census Bureau. Data compiled by the William C. Velasquez Institute
US Population Comparison by Ethnic Group, 1970-2050 *Includes American Indian and Alaska Native alone, Native Hawaiian and Other Pacific Islander alone, and Two or More Races **Hispanic origin based on Spanish language. Note: 1970-90 Figures are from sampled counts. Source: U.S. Census Bureau. Data compiled by the William C. Velasquez Institute
US Citizen Voting-Age Population Comparison by Ethnic Group, 2000-2025 (Numbers in thousands) *AIAN : American Indian and Alaska Native / API : Asian and Pacific Islander Note: White CVAP is inclusive of Hispanic figures. Source: Projections of the Population of Voting Age, for States, by Race, Hispanic Origin, Sex, and Selected Ages, U.S. Census Bureau, WCVI Projections. Data compiled by the William C. Velasquez Institute
US Citizen Voting-Age Population Shares by Ethnic Group, 2000-2025 *AIAN : American Indian and Alaska Native / API : Asian and Pacific Islander Note: White CVAP is inclusive of Hispanic figures. Due to aggregation of Hispanic figures, percentages do not equal 100%. White Non-Latino CVAP calculated by disaggregating Latino CVAP figures. Source: Projections of the Population of Voting Age, for States, by Race, Hispanic Origin, Sex, and Selected Ages, U.S. Census Bureau, WCVI Projections. Data compiled by the William C. Velasquez Institute
Total U.S. Citizen Voting-Age Population by Ethnic Group, (2000-2025) *AIAN : American Indian and Alaska Native / API : Asian and Pacific Islander Note: White CVAP is inclusive of Hispanic figures. Source: Projections of the Population of Voting Age, for States, by Race, Hispanic Origin, Sex, and Selected Ages, U.S. Census Bureau, WCVI Projections. Data compiled by the William C. Velasquez Institute
Growth of Total U.S. Citizen Voting-Age Population by Ethnic Group, (2000-2025) (Numbers in thousands) *AIAN : American Indian and Alaska Native / API : Asian and Pacific Islander Note: White CVAP is inclusive of Hispanic figures. Source: Projections of the Population of Voting Age, for States, by Race, Hispanic Origin, Sex, and Selected Ages, U.S. Census Bureau, WCVI Projections. Data compiled by the William C. Velasquez Institute
Growth of Total U.S. Citizen Voting-Age Population by Ethnic Group, (2000-2025) *AIAN : American Indian and Alaska Native / API : Asian and Pacific Islander Note: White CVAP is inclusive of Hispanic figures. Source: Projections of the Population of Voting Age, for States, by Race, Hispanic Origin, Sex, and Selected Ages, U.S. Census Bureau, WCVI Projections. Data compiled by the William C. Velasquez Institute
California Population Comparison by Ethnic Group, 2000-2050 Source: State of California, Department of Finance, Population Projections by Race/Ethnicity, Gender and Age for California and Its Counties 2000-2050, Sacramento, California, May 2004. Note: The Department of Finance uses a baseline cohort-component method to project population by gender, race/ethnicity and age. For the purposes of this projection, the seven-race/ethnic categories are mutually exclusive. Minority refers to Latino, Asian/Pacific Islander, Black, and American Indian populations. Data compiled by the William C. Velasquez Institute
California Population Shares by Ethnic Group, 2000-2050 Source: State of California, Department of Finance, Population Projections by Race/Ethnicity, Gender and Age for California and Its Counties 2000-2050, Sacramento, California, May 2004. Note: The Department of Finance uses a baseline cohort-component method to project population by gender, race/ethnicity and age. For the purposes of this projection, the seven-race/ethnic categories are mutually exclusive. Minority refers to Latino, Asian/Pacific Islander, Black, and American Indian populations. Due to aggregation of Hispanic figures, percentages do not equal 100%. Data compiled by the William C. Velasquez Institute
Growth of Total California Population by Ethnic Group, (2000-2050) Source: State of California, Department of Finance, Population Projections by Race/Ethnicity, Gender and Age for California and Its Counties 2000-2050, Sacramento, California, May 2004. Note: The Department of Finance uses a baseline cohort-component method to project population by gender, race/ethnicity and age. For the purposes of this projection, the seven-race/ethnic categories are mutually exclusive. Minority refers to Latino, Asian/Pacific Islander, Black, and American Indian populations. Data compiled by the William C. Velasquez Institute
Composition of Total population of California by Race/Ethnicity, 2000-2050, May 2004 Source: State of California, Department of Finance, Population Projections by Race/Ethnicity, Gender and Age for California and Its Counties 2000-2050, Sacramento, California, May 2004. Note: The Department of Finance uses a baseline cohort-component method to project population by gender, race/ethnicity and age. For the purposes of this projection, the seven-race/ethnic categories are mutually exclusive. Minority refers to Latino, Asian/Pacific Islander, Black, and American Indian populations. Data compiled by the William C. Velasquez Institute
State of California, Department of Finance, Population Projections by Race/Ethnicity, 2000-2050, Sacramento, California, May 2004. Source: State of California, Department of Finance, Population Projections by Race/Ethnicity, Gender and Age for California and Its Counties 2000-2050, Sacramento, California, May 2004. Note: The Department of Finance uses a baseline cohort-component method to project population by gender, race/ethnicity and age. For the purposes of this projection, the seven-race/ethnic categories are mutually exclusive. Data compiled by the William C. Velasquez Institute
California Citizen Voting-Age Population Comparison by Ethnic Group, 2000-2025 (Numbers in thousands) *AIAN : American Indian and Alaska Native / API : Asian and Pacific Islander Note: White CVAP is inclusive of Hispanic figures. Source: Projections of the Population of Voting Age, for States, by Race, Hispanic Origin, Sex, and Selected Ages, U.S. Census Bureau, WCVI Projections. Data compiled by the William C. Velasquez Institute
California Citizen Voting-Age Population Shares by Ethnic Group, 2000-2025 *AIAN : American Indian and Alaska Native / API : Asian and Pacific Islander Note: White CVAP is inclusive of Hispanic figures. Due to aggregation of Hispanic figures, percentages do not equal 100%. White Non-Latino CVAP calculated by disaggregating Latino CVAP figures. Source: Projections of the Population of Voting Age, for States, by Race, Hispanic Origin, Sex, and Selected Ages, U.S. Census Bureau, WCVI Projections. Data compiled by the William C. Velasquez Institute
Total California Citizen Voting-Age Population by Ethnic Group, (2000-2025) *AIAN : American Indian and Alaska Native / API : Asian and Pacific Islander Note: White CVAP is inclusive of Hispanic figures. Source: Projections of the Population of Voting Age, for States, by Race, Hispanic Origin, Sex, and Selected Ages, U.S. Census Bureau, WCVI Projections. Data compiled by the William C. Velasquez Institute
Growth of Total California Citizen Voting-Age Population by Ethnic Group, (2000-2025) (In Thousands) *AIAN : American Indian and Alaska Native / API : Asian and Pacific Islander Note: White CVAP is inclusive of Hispanic figures. Source: Projections of the Population of Voting Age, for States, by Race, Hispanic Origin, Sex, and Selected Ages, U.S. Census Bureau, WCVI Projections. Data compiled by the William C. Velasquez Institute
Growth of Total California Citizen Voting-Age Population by Ethnic Group, Real Numerical Growth by Ethnic Group (2000-2025) *AIAN : American Indian and Alaska Native / API : Asian and Pacific Islander Note: White CVAP is inclusive of Hispanic figures. Source: Projections of the Population of Voting Age, for States, by Race, Hispanic Origin, Sex, and Selected Ages, U.S. Census Bureau, WCVI Projections. Data compiled by the William C. Velasquez Institute
Texas Population Comparison by Ethnic Group, 2000-2040 Source: Population Estimates and Projections Program, Texas State Data Center, Office of the State Demographer, Institute for Demographic and Socioeconomic Research, The University of Texas at San Antonio. Data compiled by the William C. Velasquez Institute
Texas Population Shares by Ethnic Group, 2000-2040 Source: Population Estimates and Projections Program, Texas State Data Center, Office of the State Demographer, Institute for Demographic and Socioeconomic Research, The University of Texas at San Antonio. Due to aggregation of Hispanic figures, percentages do not equal 100%. Data compiled by the William C. Velasquez Institute
Growth of Total Texas Population by Ethnic Group, (2000-2040) Source: Population Estimates and Projections Program, Texas State Data Center, Office of the State Demographer, Institute for Demographic and Socioeconomic Research, The University of Texas at San Antonio. Data compiled by the William C. Velasquez Institute
Texas Population Comparison by Ethnic Group, 2000-2040 Source: Population Estimates and Projections Program, Texas State Data Center, Office of the State Demographer, Institute for Demographic and Socioeconomic Research, The University of Texas at San Antonio. Data compiled by the William C. Velasquez Institute
Texas Citizen Voting-Age Population Comparison by Ethnic Group, 2000-2025 (Numbers in thousands) *AIAN : American Indian and Alaska Native / API : Asian and Pacific Islander Note: White CVAP is inclusive of Hispanic figures. Source: Projections of the Population of Voting Age, for States, by Race, Hispanic Origin, Sex, and Selected Ages, U.S. Census Bureau, WCVI Projections. Data compiled by the William C. Velasquez Institute
Texas Citizen Voting-Age Population Shares by Ethnic Group, 2000-2025 *AIAN : American Indian and Alaska Native / API : Asian and Pacific Islander Note: White CVAP is inclusive of Hispanic figures. Due to aggregation of Hispanic figures, percentages do not equal 100%. White Non-Latino CVAP calculated by disaggregating Latino CVAP figures. Source: Projections of the Population of Voting Age, for States, by Race, Hispanic Origin, Sex, and Selected Ages, U.S. Census Bureau, WCVI Projections. Data compiled by the William C. Velasquez Institute
Total Texas Citizen Voting-Age Population by Ethnic Group, (2000-2025) *AIAN : American Indian and Alaska Native / API : Asian and Pacific Islander Note: White CVAP is inclusive of Hispanic figures. Source: Projections of the Population of Voting Age, for States, by Race, Hispanic Origin, Sex, and Selected Ages, U.S. Census Bureau, WCVI Projections. Data compiled by the William C. Velasquez Institute
Growth of Total Texas Citizen Voting-Age Population by Ethnic Group, (2000-2025) *AIAN : American Indian and Alaska Native / API : Asian and Pacific Islander Note: White CVAP is inclusive of Hispanic figures. Source: Projections of the Population of Voting Age, for States, by Race, Hispanic Origin, Sex, and Selected Ages, U.S. Census Bureau, WCVI Projections. Data compiled by the William C. Velasquez Institute
Growth of Total Texas Citizen Voting-Age Population by Ethnic Group, Real Numerical Growth by Ethnic Group (2000-2025) *AIAN : American Indian and Alaska Native / API : Asian and Pacific Islander Note: White CVAP is inclusive of Hispanic figures. Source: Projections of the Population of Voting Age, for States, by Race, Hispanic Origin, Sex, and Selected Ages, U.S. Census Bureau, WCVI Projections. Data compiled by the William C. Velasquez Institute