Download
1 / 26
260 likes | 362 Views
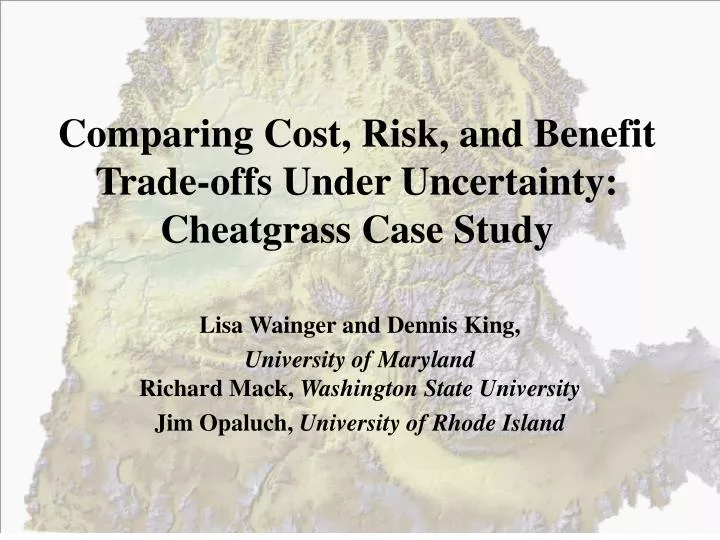
Comparing Cost, Risk, and Benefit Trade-offs Under Uncertainty: Cheatgrass Case Study. Lisa Wainger and Dennis King, University of Maryland Richard Mack, Washington State University Jim Opaluch, University of Rhode Island. Evaluate Risks of No Treatment Option.

E N D
Comparing Cost, Risk, and Benefit Trade-offs Under Uncertainty: Cheatgrass Case Study Lisa Wainger and Dennis King, University of MarylandRichard Mack, Washington State University Jim Opaluch, University of Rhode Island
Evaluate Risks of No Treatment Option Estimate Costs and Risk-Adjusted Benefits of Site/Treatment Options Identify Options with highest Cost-Effectiveness Test Assumptions Select Portfolio of Options to Manage Risk Decision Framework Establish Management Priorities
Decision analysis components to examine with case study • Benefits of Treatment • How do measures of damage avoided vary with location and scale of analysis? • Probability of Successful Restoration • How do site, location and characteristics of invasion influence whether ecosystem services will be restored? • Costs of Treatment • How do costs vary by location and scale of treatment?
1930s - present Bromus tectorum (cheatgrass) distribution through time
Federal Land Ownership Source data: USGS
Risks created by cheatgrass invasion Increasing scale
with project without project Measuring Benefits Benefits E D Time i = service, t = time period
Risk-Adjusted Benefits as a Function of Site and Landscape Conditions Performance Risk Service Value Index Service Capacity Service Scarcity Service Loss Risk Treatment effectiveness X Site Qualities E= [f(sr,lr) * p] + [f(sd,ld) * (1- p)] s = site qualities; l = location factors r = restored conditions; d = degraded conditions p = probability of restoring service
Does the Site Provide a Valued Service? • Site has features necessary to produce service • Site has capacity to produce service because “users” have access and complementary inputs are available • Service value is enhanced because service is scarce and substitutes are unavailable or expensive • The risk that the stream of services will end due to factors beyond the control of restoration is low.
Fire Risk Source data: USDA FS ICBEMP
Treatment Scenarios • Preventive reseeding following fire • Apply to uninvaded sites • Spread seeds aerially or use drill-seeding • Sometimes follow aerial seeding with chaining • Herbicide treatment of existing stands • Applied to heavily invaded sites • Multi-step process of burning, herbicide, seeding
Treatment Decision Tree Cheatgrass Dominant B1 native Natives Dominant B3 Type of Seed treat Cheatgrass Dominant B1 Treat / No-treat forage Forage Species Dominant B2 No-treat CheatgrassDominant B1 (p = 0.90) NativesDominant B3 (p = 0.10)
Restorability Model Cheatgrassregrowth Site Variables Probability of Success Landscape Variables New cheatgrassinfestation Stochastic Variables Native / Forage regrowth
Comparing Restorability sparse dense Contagion Index = 0.30 Contagion Index = 0.85
Evaluating Costs • Trying to supply treatment effort to multiple sites for minimum cost • How do costs vary over infested area? • How many sites to treat? • How much area to treat in each location? • Is it worth treating?
Site Town Road Minimum-Cost Network Flow Initial Costjk = Fixed Costk + Travel Costj*timej + Search Costj*area+ Treatment Costjk*areaj = location k=treatment methodSC = f(site factors); TC = g(site factors)
low high Cost Per Unit Distance
Not Infested Treated area m High Cost Avg. Cost Low cost Lowest cost Source cell MC = max {cell costjk |m} Evaluating Marginal Costs of Treatment Cell Costjk = Travel Cj*timej + Search Cj*area+ Treat Cjk*areaj = location k=treatment method
Comparing Costs and Kill Efficiency sparse dense
Uncertainty of Returns from Treatment Reversibility of Decline Ecosystem Service Benefits Site A p Risk of Treatment Failure Intensity of Invasion
Transferring Results to Risk Analysis for Recent Invasions • How well do GIS databases perform for doing this type of modeling? • What were the main factors contributing to cost of control and degree of impact? • How does an evaluation of cost-effectiveness change with the scale of analysis? • How do costs of control and level of impact change through time? • How have transitions in land uses (e.g., recreation vs. rangeland) changed our perception of the impacts of cheatgrass? • Given our current values, when, in the progression of the cheatgrass invasion, would treatment have been the most cost-effective?