Download
1 / 50
710 likes | 1.14k Views
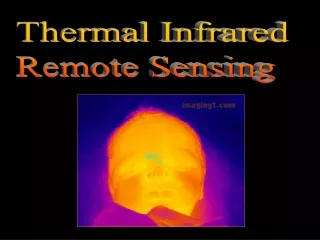
Thermal Infrared Remote Sensing. Lecture 8. Thermal infrared of EM spectrum. All objects have a temperature above absolute zero (0 K) emit EM energy (in 3.0-100 µm). Human being has normal 98.6 ºF (37 ºC)

E N D
Thermal Infrared Remote Sensing Lecture 8
Thermal infrared of EM spectrum • All objects have a temperature above absolute zero (0 K) emit EM energy (in 3.0-100 µm). • Human being has normal 98.6 ºF (37 ºC) • Our eyes are only sensitive to visible energy (0.4-0.7 µm). Human sense thermal energy through touch. while detectors (sensors) are sensitive to all EM spectrum. • All objects (vegetation, soil, rock, water, concrete, etc) selectively absorb solar short-wavelength energy and radiate thermal infrared energy. 100 m 3.0 m 0.7 m
Thermal infrared remote sensing measures: • Land and ocean surface temperature, • Atmospheric • Temperature and humility • Trace gas concentrations • Radiation balance • Emissivity
Kinetic heat, radiant flux and temperature, • The energy of particles of matter in random motion is called kinetic heat (also referred to as internal, real, or true heat). • We can measure the true kinetic temperature (Tkin) or concentration of this heat using a thermometer. - We perform this in situ (in place) temperature measurement when we are ill. - We can also measure the true kinetic internal temperature of soil or water by physically touching them with a thermometer. • When these particles (have kinetic heat) collide they change their energy state and emit electromagnetic radiation called radiant flux (watts). The concentration of the amount of radiant flux exiting (emitted from) an object is its radiant temperature (Trad). • There is usually a high positive correlation between the true kinetic temperature of an object (Tkin) and the amount of radiant flux radiated from the object (Trad). Therefore, we can utilize radiometers placed some distance from the object to measure its radiant temperature which hopefully correlates well with the object’s true kinetic temperature. Thisis the basis of thermal infrared remote sensing. • Unfortunately, the relationship is notperfect, with the remote measurement of the radiant temperature always being slightly less than the true kinetic temperature of the object. This is due to a thermal property called emissivity.
Planck equation Black body radiation (W m-2m-1) using Planck equation: We call T the physical (kinetic) temperature λ K=(°F-32)/1.8+273.15 http://tes.asu.edu/MARS_SURVEYOR/MGSTES/TES_emissivity.html
Not a perfect emitter http://tes.asu.edu/MARS_SURVEYOR/MGSTES/TES_emissivity.html
Emmisivity • Emissivity spectrum is the ratio of radiance spectrum of a non-perfect emitter over that of a perfect emitter (blackbody) at the same temperature
Brightness temperature, and physical (surface) temperature • Through radiance recorded by a remote sensor, if we use the Planck equation, we can get a temperature, which we call brightness temperature Tb, which is less than the real physical (or surface) temperature T. h, Planck’s constant =6.626 x 10⁻³⁴ Ws2 T, Kelvin (K) c, 3 x 10⁸ m/s k, Boltzmann’s constant=1.38 x 10⁻²³ Ws/K L or B, radiance (Wm-2μm-1) c1=2πhc2=3.74 x 10⁻¹⁶ Wm2 c2=hc/k=0.0144 mK
Thermal Radiation Raw • Blackbody (perfect absorber and emitter) • Stenfan-Boltzmann Law (MB = T4 in Wm-2) • Wien’s Displacement Law (max = 2898/T) • Emissivity ( = MR / MB) at the same temperature • MB = Tkin4 • MR = Trad4 • = MR / MB= Trad4 / Tkin4 • The dominant wavelength (max ) provides valuable information about which part of the thermal spectrum we might want to sense in. For example, if we are looking for 800 ˚K forest firesthat have a dominant wavelength of approximately3.62 µmthen the most appropriate remote sensing system might be a 3-5 µmthermal infrared detector. - MODIS band 20-25 are in 3-5 µm. • If we are interested insoil, water, and rock with ambient temperatures on the earth’s surface of 300 ˚Kand a dominant wavelength of 9.66 µm, then a thermal infrared detector operating in the 8 - 14 µmregion might be most appropriate. - Landsat image thermal band (6) is in 10.4-12.5µm - ASTER band 12 and 13 are in8 - 14 µm - MODIS band 29-30 and 31-32 are in 8 - 14 µm
Diurnal Temperature Cycle of Typical Materials • • The diurnal cycle encompasses 24 hours. Beginning at sunrise, the earth begins intercepting mainly short wavelength energy (0.4 - 0.7 m) from the Sun. From about 6:00 am to 8:00 pm, the terrain intercepts the incoming short wavelength energy and reflects much of it back into the atmosphere where we can use optical remote sensors to measure the reflected energy. • However, some of the incident short wavelength energy is absorbed by the terrain and then re-radiated back into the atmosphere as thermal infrared long wavelength radiation (3 - 100 m). The outgoing longwave radiation reaches its highest value during the day when the surface temperature is highest. This peak usually lags two to four hours after the midday peak of incoming shortwave radiation, owing to the time taken to heat the soil. • The contribution of reflected short wavelength energy and emitted long wavelength energy causes an energy surplus to take place during the day. Both incoming and outgoing shortwave radiation become zero after sunset (except for light from the moon and stars), but outgoing longwave radiation continues all night.
Peak Period of Daily Outgoing Longwave Radiation and the Diurnal Radiant Temperature of Soils and Rocks, Vegetation, Water, Moist Soil and Metal Objects Temperature At the thermal crossover times, most of the materials have the almost same radiant temperature, it is not wise to do thermal remote sensing. Water and vegetation have higher thermal capacity. In different time of thermal images, there are different performances even the materials.
Kirchoff’s radiation law • i = r + + • 1 = r + + • Kirchoff found in the infrared portion of the spectrum = : “good absorbers are good emitters” • Most materials does not lose any incident energy to transmittance, i.e. = 0, so we can get 1 = r + = r + (or A + ε) • This means reflectivity and emissivity has a inverse relationship: “good reflectors are poor emitters”
NASA’s Earth Observing System missions with Thermal IR capability • Landsat systems (MSS, TM, ETM+) • ETM+ has a 60 m band at 10.5-12.5 µm) • TRMM • CERES • EOS Terra (Dec. 1999) • CERES, MODIS, ASTER, MOPITT • EOS Aqua (May 2002) • AIRS, CERES, MODIS • EOS Aura (July 2004) • HIRDLS, TES
MODIS land surface temperature and emissivity product led by Dr. Wan http://www.icess.ucsb.edu/modis/modis-lst.html
Calibration and validation of MODIS T and E in Sevilleta, NM
Urban Heat Island of San Antonio downtown area detected by MODIS temperature product 2:30 pm (CDT), July 14, 2004 Xie and Ytuarte, 2005
Urban Heat Island of San Antonio downtown area detected by MODIS temperature product 2:00 am (CDT), July 15, 2004 Xie and Ytuarte, 2005
Active fire detection:MODIS fire and thermal anomalies products http://modis-fire.gsfc.nasa.gov/index.asp Image caption: Fires in the Bahamas, Florida and Cuba (03 April 2004, 18:30 UTC) identified using MODIS Aqua and outlined in red on the MODIS 1km corrected reflectance product
NASA Mars missions with Thermal IR capability • Mars global surveyor • Launched 11/1996. landed 12/1997, 3/1999 began have maps • TES (6-50 μm) • Mars Odyssey • Launched 4/7/2001, landed 10/24/2001 • THEMIS (5 visible at 18m, 10 thermal (6.78-10.88 μm) at 100m) • Mars Spirit Rover • Launched 6/10/2003, landed 1/3/2004 • Mini-TES • Mars opportunity Rover • Launched 7/7/2003, landed 1/24/2004 • Mini-TES
What is TES?Thermal Emission Spectroscopy • Michelson Interferometer, is the thermal IR portion of TES, covers the 6-50 µm (1655-200 cm-1) wavelength range, with spectralsampling 5 and10 cm-1 (spectralresolution ~10 - 20 cm-1), 286 or 142 bands • Bolometric thermal radiance channel(5.5 to ~100 µm) • Solar reflectance channel(0.3 to 2.7 µm ),to measure the brightness of reflected solar energy
MGS - TES Entered Mars orbit on board the MGS on Sep.11,1997
How does TES determine surface composition? Mixed Spectra • Rocks are a mixture of minerals • Emissivity spectrum from individual components of a mixture add together in a simple linear fashion. • The linearity of the mixed spectrum allows it to be deconvolved.
Two distinct surface types found on Mars Type 1 - Similar to Basalt Type 2 – Andesite? ( < 52 wt% SiO2) ( 52-63 wt% SiO2) Mostly in southern highlands Mostly in northern lowlands (note the larger percentage of high silica glass is the main diff.) Bandfield et al. (2000), Hamilton et al. (2001)
MGS TES Basalt Map Basalt (Type 1 spectra) concentrated in Southern Highlands Bandfield et al. (2000), Hamilton et al. (2001)
MGS TES Andesite Map Andesite (type 2 spectra) appears concentrated in Northern Lowlands, but also intermixed with basalt in Southern Highlands. Bandfield et al. (2000), Hamilton et al. (2001)
Rocks at the Mars Opportunity Rover landing site (on 1/24/2004, launched 7/7/2003)
NOAA and other missions with Thermal IR capability • GOES (NOAA) • 3.78-4.03 (4 km), 6.47-7.02 (8 km), 10.2-11.2 (4 km), and 11.5-12.5 (4 km) • AVHRR (NOAA) • 3.55-3.93, 10.30-11.30, 11.5-12.5. all in 1.1 km • NPOESS (joint NOAA/NASA/DoD) • Middle-wave thermal 8 bands, long-wave thermal 4 bands • http://www.ipo.noaa.gov/Technology/viirs_summary.html • 400-800 m
One application: detection of loss of heat from buildings due to faulty insulation
Typical IR imagery of Heat Loss in Residential Structures Furnace Vent Vent Duct
Energy Gain (Floor Leak) Missing Insulation in Vaulted Ceiling Area Heat Loss Heat Loss Moisture
Typical Institutional Building Heat Loss Typical Air Leak Patterns
Typical air in-leakage at doors Apartment balcony door during the summer the A/C system reads a slight positive pressure but this building is under a negative pressure, bringing in warm, moist air into the building through walls, doors, ceilings and under the floor system. Typical pattern of air in-leakage Typical pattern of air in-leakage
Air Leakage from non-insulated areas and window frames.