Download
1 / 1
20 likes | 140 Views
Pore size distribution assessed by different techniques. M. A. Slasli a , F.Stoeckli a , D.Hugi-Cleary a and A.Guillot b a Chemistry Department of the University, Avenue de Bellevaux 51, CH-2007 Neuchâtel, Switzerland

E N D
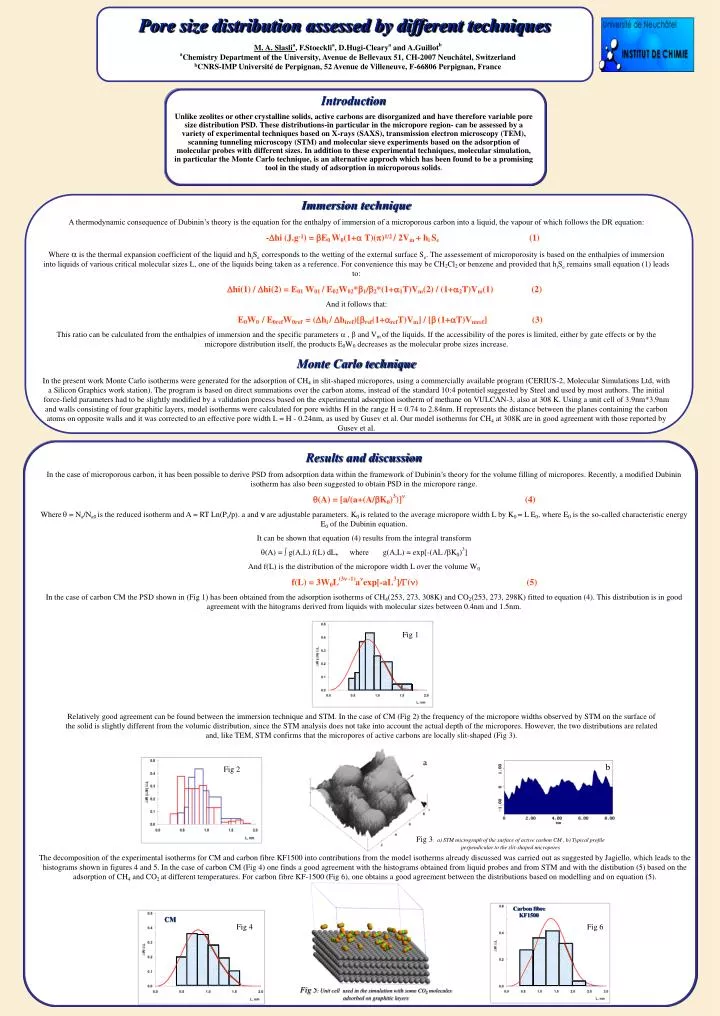
Pore size distributionassessed by different techniques M. A. Slaslia, F.Stoecklia, D.Hugi-Clearya and A.Guillotb aChemistry Department of the University, Avenue de Bellevaux 51, CH-2007 Neuchâtel, Switzerland bCNRS-IMP Université de Perpignan, 52 Avenue de Villeneuve, F-66806 Perpignan, France Introduction Unlike zeolites or other crystalline solids, active carbons are disorganized and have therefore variable pore size distribution PSD. These distributions-in particular in the micropore region- can be assessed by a variety of experimental techniques based on X-rays (SAXS), transmission electron microscopy (TEM), scanning tunneling microscopy (STM) and molecular sieve experiments based on the adsorption of molecular probes with different sizes. In addition to these experimental techniques, molecular simulation, in particular the Monte Carlo technique, is an alternative approch which has been found to be a promising tool in the study of adsorption in microporous solids. Immersion technique A thermodynamic consequence of Dubinin’s theory is the equation for the enthalpy of immersion of a microporous carbon into a liquid, the vapour of which follows the DR equation: -hi (J.g-1) = E0 W0(1+a T)(p)1/2 / 2Vm + hi Se(1) Where a is the thermal expansion coefficient of the liquid and hiSe corresponds to the wetting of the external surface Se. The assessement of microporosity is based on the enthalpies of immersion into liquids of various critical molecular sizes L, one of the liquids being taken as a reference. For convenience this may be CH2Cl2 or benzene and provided that hiSe remains small equation (1) leads to: hi(1) / hi(2) = E01 W01 / E02W02*1/2*(1+1T)Vm(2) / (1+2T)Vm(1) (2) And it follows that: E0W0 / E0refW0ref = (hi / hiref)[ref(1+refT)Vm] / [(1+T)Vmref] (3) This ratio can be calculated from the enthalpies of immersion and the specific parameters , and Vm of the liquids. If the accessibility of the pores is limited, either by gate effects or by the micropore distribution itself, the products E0W0 decreases as the molecular probe sizes increase. Monte Carlo technique In the present work Monte Carlo isotherms were generated for the adsorption of CH4 in slit-shaped micropores, using a commercially available program (CERIUS-2, Molecular Simulations Ltd, with a Silicon Graphics work station). The program is based on direct summations over the carbon atoms, instead of the standard 10:4 potentiel suggested by Steel and used by most authors. The initial force-field parameters had to be slightly modified by a validation process based on the experimental adsorption isotherm of methane on VULCAN-3, also at 308 K. Using a unit cell of 3.9nm*3.9nm and walls consisting of four graphitic layers, model isotherms were calculated for pore widths H in the range H = 0.74 to 2.84nm. H represents the distance between the planes containing the carbon atoms on opposite walls and it was corrected to an effective pore width L = H - 0.24nm, as used by Gusev et al. Our model isotherms for CH4 at 308K are in good agreement with those reported by Gusev et al. Results and discussion In the case of microporous carbon, it has been possible to derive PSD from adsorption data within the framework of Dubinin’s theory for the volume filling of micropores. Recently, a modified Dubinin isotherm has also been suggested to obtain PSD in the micropore range. (A) = [a/(a+(A/K0)3)](4) Where = Na/Na0 is thereduced isotherm and A = RT Ln(Ps/p). a and are adjustableparameters. K0 is related to the average micropore width L by K0 = L E0, where E0 is the so-called characteristic energy E0 of the Dubinin equation. It can be shown that equation (4) results from the integral transform (A) = g(A,L) f(L) dL, whereg(A,L) = exp[-(AL /K0)3] And f(L) is the distribution of the micropore width L over the volume W0 f(L) = 3W0L(3 -1)aexp[-aL3]/()(5) In the case of carbon CM the PSD shown in (Fig 1) has been obtained from the adsorption isotherms of CH4(253, 273, 308K) and CO2(253, 273, 298K) fitted to equation (4). This distribution is in good agreement with the hitograms derived from liquids with molecular sizes between 0.4nm and 1.5nm. Fig 1 Relatively good agreement can be found between the immersion technique and STM. In the case of CM (Fig 2) the frequency of the micropore widths observed by STM on the surface of the solid is slightly different from the volumic distribution, since the STM analysis does not take into account the actual depth of the micropores. However, the two distributions are related and, like TEM, STM confirms that the micropores of active carbons are locally slit-shaped (Fig 3). a b Fig 2 Fig 3: a) STM micrograph of the surface of active carbon CM , b) Typical profile perpendicular to the slit-shaped micropores The decomposition of the experimental isotherms for CM and carbon fibre KF1500 into contributions from the model isotherms already discussed was carried out as suggested by Jagiello, which leads to the histograms shown in figures 4 and 5. In the case of carbon CM (Fig 4) one finds a good agreement with the histograms obtained from liquid probes and from STM and with the distibution (5) based on the adsorption of CH4 and CO2 at different temperatures. For carbon fibre KF-1500 (Fig 6), one obtains a good agreement between the distributions based on modelling and on equation (5). Carbon fibre KF1500 CM Fig 4 Fig 6 Fig 5: Unit cell used in the simulation with some CO2 molecules adsorbed on graphitic layers