Download
1 / 23
240 likes | 401 Views
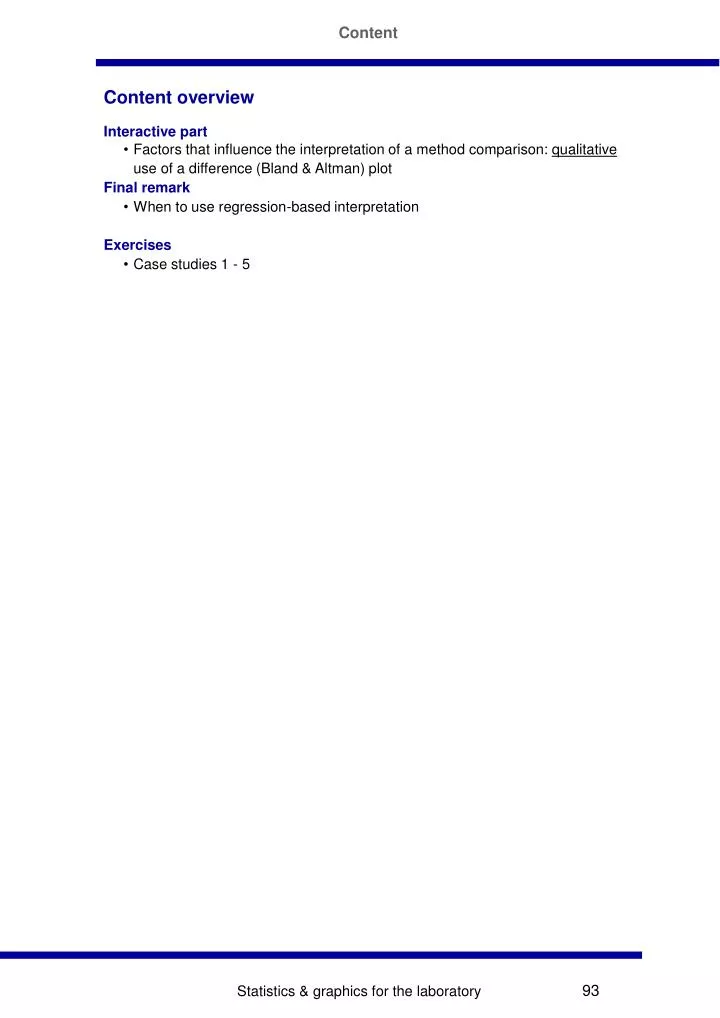
Content. Content overview. Interactive part Factors that influence the interpretation of a method comparison: qualitative use of a difference (Bland & Altman) plot Final remark When to use regression-based interpretation Exercises Case studies 1 - 5. Interactive part.

E N D
Content Content overview • Interactive part • Factors that influence the interpretation of a method comparison: qualitative use of a difference (Bland & Altman) plot • Final remark • When to use regression-based interpretation • Exercises • Case studies 1 - 5 Statistics & graphics for the laboratory
Interactive part Factors that influence the interpretation of a method comparison • Qualitative use of a difference (Bland & Altman) plot • How it works – The plot & the task • How it works – Example Statistics & graphics for the laboratory
Interactive part Factors that influence the interpretation of a method comparison • Glucose "biological criteria": Maximum deviation: 6.3% • Glucose “CLIA criteria”: Maximum deviation: 0.33 mmol/l or 10% • Glucose "Glucometer-criteria": Maximum deviation = 20% • 1st observationData were the same for all • Specifications were 6.3, 10, 20% • May depend on specification! Decision ……………………………………………………………………… Decision ……………………………………………………………………… Decision ……………………………………………………………………… Statistics & graphics for the laboratory
Interactive part The quality of the comparison method • Cave: Total variance of a method comparison! • CVTot = SQRT[CV2Ref + CV2Rout] • Specifications are for CVRef = 0! Otherwise: Expand specifications! • Errors in the comparison method • Expand specifications! • Start specification: S (10.4%) • The comparison method has a bias B (2%) • The new specification becomes: Snew = S + B (10.4 + 2 = 12.4%) • The comparison method has an imprecision (2%) that cannot be neglected in comparison to the specification (understood as "2 SD"-limit) • The new specification becomes: Snew = 2 • [(S/2)2 + CVComp2]0.5 (2•[5.2•5.2+2•2] = 11.1%) • In case of combination of both error types • The new specification becomes: Snew = B + 2 • [(S/2)2 + CVComp2]0.5 (2+11.1 = 13.1%) Statistics & graphics for the laboratory
Interactive part The quality of the comparison ("Referral") method • 2nd observation • May depend on the quality of the comparison method! • Glucose "biological criteria": Maximum deviation: 6.3% • 3rd observation • May depend on the distribution of the outlying differences! Decision ……………………………………………………………………… Statistics & graphics for the laboratory
Interactive part Factors that influence the interpretation of a method comparison • Glucose "biological criteria": Maximum deviation: 6.3% • Glucose "biological criteria": Maximum deviation: 6.3% • Glucose "biological criteria": Maximum deviation: 6.3% Decision ……………………………………………………………………… Decision ……………………………………………………………………… Decision ……………………………………………………………………… Statistics & graphics for the laboratory
Interactive part Factors that influence the interpretation of a method comparison • Statistics behind • 2-sided 95% confidence limits of SD and sample size n • 4th observation • May depend on the sample size • Summary – Interactive part • Decisions are influenced by • "Quality" of specification • Quality of comparison method • Distribution at "critical" analyte values • Sample size (95% CL of, e.g., "2s") Statistics & graphics for the laboratory
The Bland & Altman approach Method comparison S-cholesterol • Comparison method • Isotope dilution - gas chromatography/mass spectrometry (ID-GC/MS) • Negligible measurement error construct the x-axis of the difference plot by use of the ID-GC/MS, only. • Test method • Routine • Bias = 2.3%, CV = 3%. • Sample sizes • 80, 40, and 20 • Plot • %-differences • Specifications • SEspec = 3% (NCEP) and TEspec = 10% (CLIA). • n = 80 n = 40 • n = 20 Observation …………………………………….……………………………………. Observation …………………………………….……………………………………. • Conclusion • Easy visual inspections from the extended Bland&Altman plot. • Importance of the sample size • Account for the sample size via the statistical estimates Observation …………………………………….……………………………………. Statistics & graphics for the laboratory
The Bland & Altman approach Regression-based interpretation … • Thienpont LM, Van Nuwenborg JE, Bland JM, Altman DG. • Stöckl D.Clin Chem 1998;44:849-57Stat Meth Med Res 1999;8:135-60 • … when systematic errors are related to the concentration! • Checklist • Consider • Sort of plot (absolute, %, "extended") • "Quality" of specification • Quality of comparison method • Distribution at "critical" analyte values • Sample size (95% CL of estimates, e.g., "2s") • Regression-based interpretation (systematic errors related to the concentration) • Sample quality (clinical relevance) Statistics & graphics for the laboratory
The Bland & Altman approach References • Altman DG, Bland JM. Measurement in medicine: the analysis of method comparison studies. Statistician 1983;32:307-17. • Bland JM, Altman DG. Statistical methods for assessing agreement between two methods of clinical measurement. The Lancet 1986;i:307-10. • Bland JM, Altman DG. Measuring agreement in method comparison studies. Stat Methods Med Res 1999;8:135-60. • Dewitte K, Fierens C, Stöckl D, Thienpont LM. Application of the Bland-Altman plot for the interpretation of method-comparison studies: a critical investigation of its practice. Clin Chem 2002;48:799-801. • Stöckl D, Rodríguez Cabaleiro D, Van Uytfanghe K, Thienpont LM. Interpreting method comparison studies by use of the bland-altman plot: reflecting the importance of sample size by incorporating confidence limits and predefined error limits in the graphic. Clin Chem 2004;50:2216-8. • Mantha S, Roizen MF, Fleisher LA, Thisted R, Foss J. Comparing methods of clinical measurement: reporting standards for Bland and Altman analysis. Anesth Analg 2000;90:593-602. • Pollock MA, Jefferson SG, Kane JW, Lomax K, MacKinnon G, Winnard CB. Method comparison - a different approach. Ann Clin Biochem 1992;29:556-60. • Stöckl D. Beyond the myths of difference plots [letter]. Ann Clin Biochem 1996;33:575-7. • Stöckl D. Difference versus mean plots [reply]. Ann Clin Biochem 1997;34:571. • Hyltoft Petersen P, Stöckl D, Blaabjerg O, Pedersen B, Birkemose E, Thienpont L, Flensted Lassen J, Kjeldsen J. Graphical interpretation of analytical data from comparison of a field method with a reference method by use of difference plots [opinion]. Clin Chem 1997;43:2039-46. • National Cholesterol Education Program. Recommendations for improving cholesterol measurements. US Department of Health and Human Services publication NIH 90-2964. Washington, DC: National Institutes of Health, 1990. • Clinical Laboratory Improvement Amendments of 1988; Final Rule. Fed Reg February 28 1992;57: 7001-288. Statistics & graphics for the laboratory
Method comparison exercises Graphical interpretation of a method comparison • By use of integrated specifications • Data not within or at the limit of the specifications • Interpret with graphical and statistical techniques Interpretation The comparison shows visuallythat the quality of the test method is well within the specification. There is no need for further investigation (for, e.g., linearity, bias, Sy/x, etc.) Conclusion Interpret the method comparison in first instance visually against the selected specification(s). Glucose “biological criteria”: Max. deviation: 6.3% Sort of specification: Proportional error Choice: % bias plot Statistics & graphics for the laboratory
Method comparison exercises Interpretation strategy • “When the data are not within or at the limit of the specifications” • General • Reconsider the quality of the samples (number, matrix) and the measurement protocol (incl. the comparison method) • Reconsider the internal quality control • Judge the comparison visually (concentration range, outliers) (consider all possible graphics) • Judge the data for linearity • Direct (if more appropriate, in the logarithmic plot) or • Use a “residuals plot” and check the sequence of the signs (+/-) of the residuals • If x and y indeed are linearly related, perform correlation analysis • If x and y are not linearly related, perform non-linear regression (only for the purpose of calibration) • Correlation analysis • If r <0.99 (broad range) or <0.975 (small to medium range), check again for outliers • When, thereafter, r sufficiently increases, perform linear regression without the outliers • Perform Deming regression (DR) (or Passing Bablok regression (PBR)) • When r does not sufficiently increase, calculate SDy/x of OLR (note: use alternatively SD of the differences yi - xi (SDdiff)) and compare with the total imprecisionof the method comparison due to both SDax and SDay • a) If SDy/xor SDdiff~ total imprecision, reduce the latter (e.g., by performing multiple measurements) • b) If SDy/xor SDdiff >>> total imprecision • there is a substantial analytical difference between the methods due to sample-related effects • Deming (PB) regression • Use the regression parameters to find the cause of the poor quality: • SE proportional (slope sign. 1) • SE constant (intercept sign. 0) • Matrix-related RE (SDy/xor SDdiff>>> total SDa) • Improve the method (perform, if more appropriate, an in-depth evaluation of the "elements" of the method: calibration, recovery, interference studies, ...). • Adapted from: Stöckl D, Dewitte K, Thienpont LM. Clin Chem 1998;44:2340-6 Statistics & graphics for the laboratory
Method comparison exercises Case study 1 • Analyte: Estradiol in serum • Samples • 24 (range: 15 - 3000 pmol/l) • 4 series of 6 samples mixed from 4 native pools and 1 "stripped" serum ("6"/0 ml; 5/1; 4/2; 3/3; 2/4; 1/5) • IQC: 3 • Design: 1 series, duplicates • Method x: GC/MS, CV 6%: confirmed from IQC and duplicates • Method y: Immunoassay, CV 6%: confirmed from IQC and duplicates • CVtot,expected:8.5% • Graphical judgement: no irregularities • Correlation/regression data: • r = 0.998; y = 1.03 (± 0.05)x - 10 (± 15) pmol/l, • Sy/x (%): 9% • Conclusion: Is the immunoassay equivalent to GC/MS? • We check all elements of the method comparison study • IQC: 3 • Design: 1 series, duplicates • Method x: GC/MS, CV 6%: confirmed from IQC and duplicates • Method y: Immunoassay, CV 6%: confirmed from IQC and duplicates • CVtot,expected:8.5% • Graphical judgement: no irregularities • Correlation/regression data: • r = 0.998; y = 1.03 (± 0.05)x - 10 (± 15) pmol/l, • SDy/x (%): 9% • Samples • 24 (range: 15 - 3000 pmol/l) • 4 series of 6 samples mixed from 4 native pools and 1 "stripped" serum ("6"/0 ml; 5/1; 4/2; 3/3; 2/4; 1/5) • Conclusion: Decision not possible, wrong design! No native samples! • Strategy, General • [Re]consider the quality of the samples (matrix) Statistics & graphics for the laboratory
Method comparison exercises Case study 2 • Case analogous to an example in literature • Analyte: HDL-cholesterol in serum • Samples: 100 native serum samples • Design: multiple series, singlicates • Method x: "reference method" (validated with the official reference method of CDC): indirect method (phosphotungstic acid/MgCl2) • Between-day CV: 3% • Method y: direct method (detergent + enzymatic) • Between-day CV: 3.8% • CVtot,expected: 4.8% • Specifications (NCEP) • SD < 0.044 mmol/l, or CV < 4% • Interpretation of combined absolute & %-specifications (select the highest) • Example: 0.044 mmol/l and 4% • • Consider the measurement range and calculate at which concentration 4% = 0.044 mmol/l • • Here: at 1.1 mmol/l is 4% = 0.044 mmol/l • > 1.1 mmol/l, use the 4% specification, • 1.1 mmol/l, use the 0.044 mmol/l specification • Specifications case 2 • SD < 0.044 mmol/l (up to 1.1 mmol/l), or CV < 4% (> 1.1 mmol/l) • But, specifications are expressed in terms of RE • Transformation of specifications for RE to TE • with the formula: TE = SE + k • RE • TE = RE • k (k = 2, Westgard “classical”; k = 3, Ehrmeyer & Laessig; k = 4, Westgard, with IQC) • We select: k = 2 for a method comparison • TE = 2 • RE (specification) = 8% • Note: Only valid when the comparison method (x) is error free. • Here: CV(x) = 3%, which cannot be neglected in comparison to • the CV of the test method (3.8%) Expand the specification Statistics & graphics for the laboratory
Method comparison exercises Expansion of specifications • Original specification (TE) = 8% • Suppose SE = 0 • The CV(x) = 3%, which cannot be neglected in comparison to the CV of the test method (3.8%) and the specification. • The new specification becomes: • Snew = 2 • [(S/2)2 + CVComp2]0.5 • = 2•[4•4+3•3] = 10.0%or • = TE(abs) = 0.11 mmol/L • Interpretation of case study 2 • Graphical presentation • & • Specifications • Absolute: • <0.11 mmol/l (up to 1.1 mmol/l) • Proportional: • <10% (>1.1 mmol/l) • “When the data are not within or at the limit of the specifications” • General • Reconsider the quality of the samples (number, matrix) and the measurement protocol (incl. the comparison method) • Reconsider the internal quality control • Judge the comparison visually (concentration range, outliers) (consider all possible graphics) • Judge the data for linearity! • -Direct (if more appropriate, • in the logarithmic plot) or • -Use a “residuals plot” and check • the sequence of the • signs (+/-) of the residuals • Something unusual? Statistics & graphics for the laboratory
Judgement of linearity: Residual-plot! Method comparison exercises Case study 2 (ctd.) • Judge the data for linearity • If the data are not linearly related • Perform non-linear regression analysis for the purpose of calibration • Calibration • Linearisation and correction for SE: • via the reverse plot and thetrend line • Note: The success of recalibration has to be checked with a new set of data! Something unusual? Statistics & graphics for the laboratory
Method comparison exercises Case study 3 • Case analogous to an example in literature • Analyte: HDL-cholesterol in serum • Samples: 100 native serum samples • Design: multiple series, singlicates • Method x: indirect method (phosphotungstic acid/MgCl2) • Between-day CV: 3% • Method y: direct method (detergent + enzymatic) • Between-day CV: 3% • CVtot,expected: 4.2% • Specifications (NCEP) • SD < 0.044 mmol/l ( 1.1 mmol/l), or CV < 4% (>1.1 mmol/l) • Note: The new specification for TE = 2•[4•4+3•3] = 10.0%or • TE(abs) = 0.11 mmol/L • Visual interpretation • Too many points outside specifications • Otherwise no irregularities • Further statistical, analytical investigations needed • General • Reconsider the quality of the samples (number, matrix) and the measurement protocol (incl. the comparison method) • Reconsider the internal quality control • Judge the comparison visually (concentration range, outliers) (consider all possible graphics) Statistics & graphics for the laboratory
Method comparison exercises Case study 3 (ctd.) • Judge the data for linearity • Direct (if more appropriate, in the logarithmic plot) or • Use a “residuals plot” and check the sequence of the signs (+/-) of the residuals • If x and y indeed are linearly related, perform correlation analysis • If x and y are not linearly related, perform non-linear regression (for the purpose of calibration) • Correlation analysis • r = 0.9803 (small range!) • If r <0.99 (broad range) or <0.975 (small to medium range), check again for outliers • When, thereafter, r sufficiently increases, perform linear regression without the outliers • When r does not sufficiently increase, calculate SDy/x of OLR or SDdiff and compare with the total SDaof the method comparison • a) If SDy/xor SDdiff~ total SDa, reduce the SDaof the method comparison (e.g., by performing multiple measurements) • b) If SDy/xor SDdiff >>> total SDa, there is a substantial analytical difference between the methods due to sample-related effects • Perform Deming regression (DR) (or Passing Bablok regression (PBR)) • Use the regression parameters to find the cause of the poor quality • SE proportional: slope (1.010 ± 0.045) • SE constant: intercept (-0.03 ± 0.058) • No problems indicated by regression. • > Look at the random differences Linear regression 95% CLs of intercept: –0.061 to 0.055 of slope 0.965 to 1.055 Note: SDy/x (OLR) = 0.116 mmol/l Statistics & graphics for the laboratory
Method comparison exercises Case study 3 (ctd.) • Compare SDy/x from OLR (0.1164 mmol/l) with thetotal SDa of the method comparison: SDy/x2 = SDay2 + b2 SDax2 (CVy/x = 2 CVay) 0.1164 >>> 0.0528 mmol/l (7.8% >> 4.2%) There is a substantial analytical difference between the methods due to sample-related effects • Alternatively: SDof the differences yi – xican be used, here SDdiff = 0.1159 mmol/l • Note: "RE" in method comparison. Not only consider the value, but compare the spread of all points in a graphic • Observation: • Too many points outside specifications due to "random" spread. • Conclusion • Improve the method. • If appropriate, perform an in-depth evaluation of the“elements” of the method: interference studies,specificity, method principle, ... • WHICH ONE? X or Y? • Experimental investigations, done after the method • comparison, according to literature • Interference studies • Hemolysis • Lipemia (caused most of the problems) • Bilirubinemia Statistics & graphics for the laboratory
Method comparison exercises Case study 4 • Case analogous to an example in literature • Analyte: Troponine-I in serum • Samples: >200 native serum samples • Design: multiple series, singlicates • Method x: immunoassay 1, CV ~ 12% • Method y: immunoassay 2, CV ~ 10% • CVtot,expected: ~ 16% • Specifications • None: Select 2 • CVtot,expected = 32% • The big slope and the high number of outliers • Have both methods specificity problems? • Is the slope only caused by a difference incalibration? • Can we be sure that both methods measure the same analyte? Graphical interpretation (incl. regression) Two problems apparent: -the outliers - the big slope Bias plot Note that the concentration range (x-values) (in particular of the "1" method) cannotlongerbe recognized >Problem of the large slope Statistics & graphics for the laboratory
Method comparison exercises Case study 5 • Case analogous to an example in literature • Analyte: Potassium in serum • Aim: eventual recalibration • Samples: 60 native serum samples • Method x: IC-reference method • Between-day CV: 1.5% (for a designof4 measurements per sample = 0.75%) • Method y: ISE • Within-day CV: 1.1% (singlicates) • Specification (CLIA) • TE = 0.48 mmol/l (= 10% at 4.8 mmol/l) • Regression in a method comparison • Judgement of the 95% CLs of the regression parameters in comparison to specifications • Uncertainty of the slope alone ca. 17% • A recalibration via the method comparison exceeds the error budget! y = 1.16 x – 0.86 95% CLs of slope = ±0.17 95% CLs of intercept = ±0.74 mmol/l Specification CLIA limit: 10% at 4.8 mmol/l Statistics & graphics for the laboratory
Notes Notes Statistics & graphics for the laboratory
Notes Notes Statistics & graphics for the laboratory